

Chart of year Obernach / Ach
Discharge from 01.01.2023 to 31.12.2023
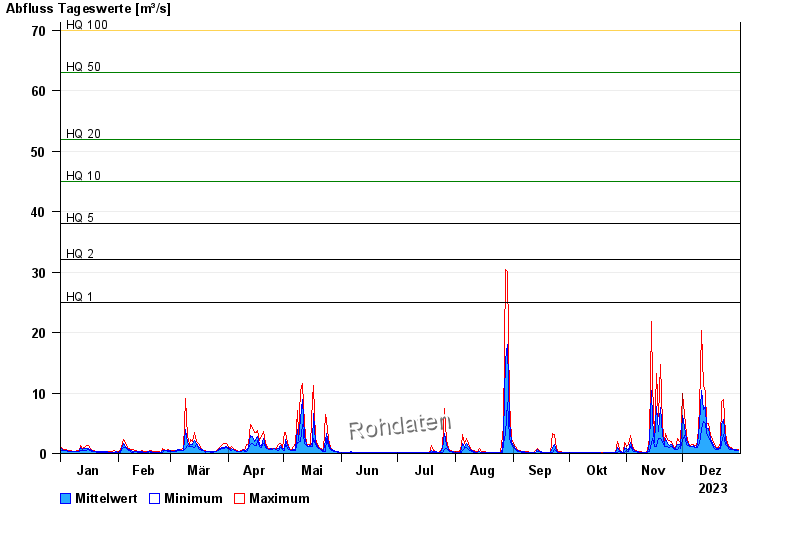
- HQ1 25 m³/s
- HQ2 32 m³/s
- HQ5 38 m³/s
- HQ10 45 m³/s
- HQ20 52 m³/s
- HQ50 63 m³/s
- HQ100 70 m³/s
| Date | Mean value [m³/s] | Maximum [m³/s] | Minimum [m³/s] |
|---|---|---|---|
| 31.12.2023 | 0.517 | 0.582 | 0.441 |
| 30.12.2023 | 0.581 | 0.633 | 0.441 |
| 29.12.2023 | 0.622 | 0.686 | 0.533 |
| 28.12.2023 | 0.662 | 0.743 | 0.582 |
| 27.12.2023 | 0.771 | 0.923 | 0.582 |
| 26.12.2023 | 0.939 | 1.11 | 0.743 |
| 25.12.2023 | 1.34 | 1.61 | 1.11 |
© Bayerisches Landesamt für Umwelt 2024