

Chart of total period Obernach / Ach
Discharge from 01.11.1953 to 26.04.2024
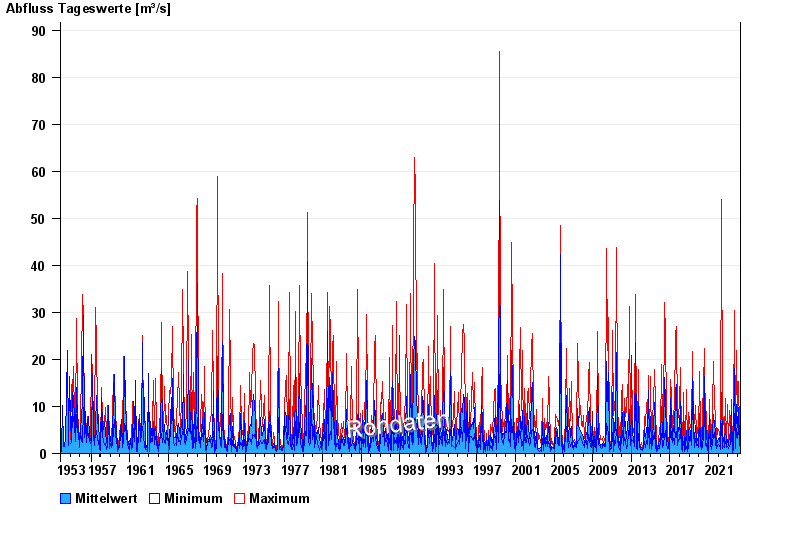
| Date | Mean value [m³/s] | Maximum [m³/s] | Minimum [m³/s] |
|---|---|---|---|
| 26.04.2024 | 1.24 | 1.48 | 1.11 |
| 25.04.2024 | 1.75 | 2.92 | 1.32 |
| 24.04.2024 | 1.73 | 3.34 | 1.18 |
| 23.04.2024 | 1.16 | 1.32 | 1.04 |
| 22.04.2024 | 0.993 | 1.11 | 0.903 |
| 21.04.2024 | 0.932 | 1.11 | 0.779 |
| 20.04.2024 | 1.01 | 1.18 | 0.665 |
© Bayerisches Landesamt für Umwelt 2024