
- Start >
- Rivers >
- Discharge >
- Isar >
- Obermühlhausen >
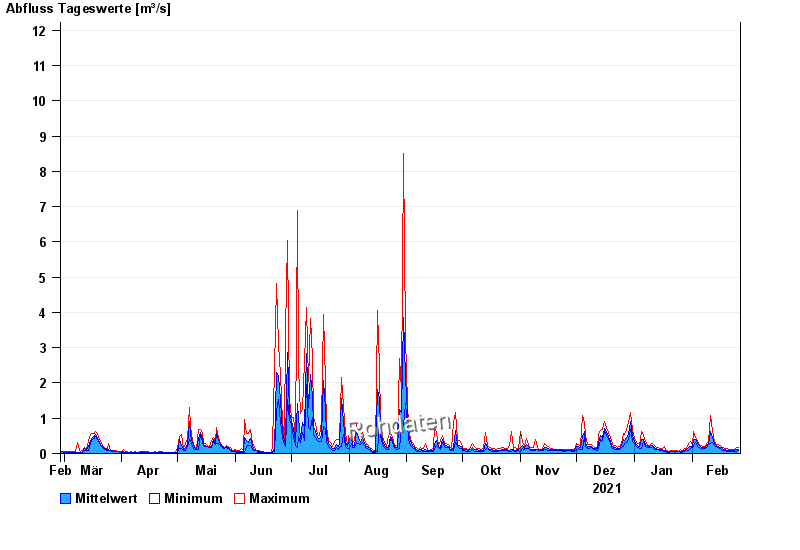
- Chart of year

Chart of year Obermühlhausen / Windach
Discharge from 27.02.2021 to 26.02.2022
- 21.05.1999 Abfluss: 25,6 m³/s
- 06.08.2000 Abfluss: 21,3 m³/s
- 02.06.2013 Abfluss: 18,8 m³/s
- 18.06.1979 Abfluss: 18,7 m³/s
- 13.04.1994 Abfluss: 16,3 m³/s
| Date | Mean value [m³/s] | Maximum [m³/s] | Minimum [m³/s] |
|---|---|---|---|
| 26.02.2022 | 0.121 | 0.165 | 0.09 |
| 25.02.2022 | 0.109 | 0.165 | 0.055 |
| 24.02.2022 | 0.094 | 0.114 | 0.07 |
| 23.02.2022 | 0.088 | 0.114 | 0.07 |
| 22.02.2022 | 0.077 | 0.114 | 0.055 |
| 21.02.2022 | 0.089 | 0.114 | 0.07 |
| 20.02.2022 | 0.098 | 0.139 | 0.07 |
© Bayerisches Landesamt für Umwelt 2024