
- Start >
- Rivers >
- Discharge >
- Isar >
- Obermühlhausen >
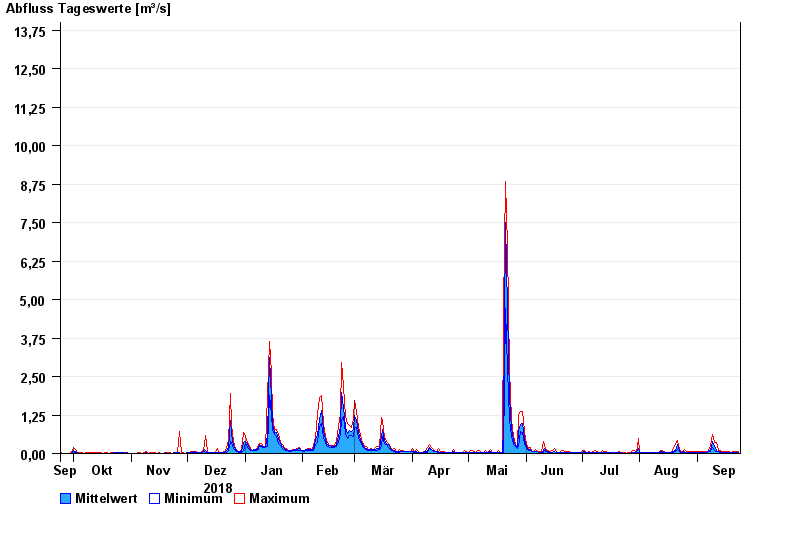
- Chart of year

Chart of year Obermühlhausen / Windach
Discharge from 24.09.2018 to 23.09.2019
- 21.05.1999 Abfluss: 25,6 m³/s
- 06.08.2000 Abfluss: 21,3 m³/s
- 02.06.2013 Abfluss: 18,8 m³/s
- 18.06.1979 Abfluss: 18,7 m³/s
- 13.04.1994 Abfluss: 16,3 m³/s
| Date | Mean value [m³/s] | Maximum [m³/s] | Minimum [m³/s] |
|---|---|---|---|
| 23.09.2019 | 0.047 | 0.068 | 0.036 |
| 22.09.2019 | 0.037 | 0.05 | 0.036 |
| 21.09.2019 | 0.037 | 0.05 | 0.036 |
| 20.09.2019 | 0.039 | 0.05 | 0.036 |
| 19.09.2019 | 0.036 | 0.036 | 0.036 |
| 18.09.2019 | 0.038 | 0.05 | 0.036 |
| 17.09.2019 | 0.04 | 0.068 | 0.025 |
© Bayerisches Landesamt für Umwelt 2024