
- Start >
- Rivers >
- Discharge >
- Isar >
- Obermühlhausen >
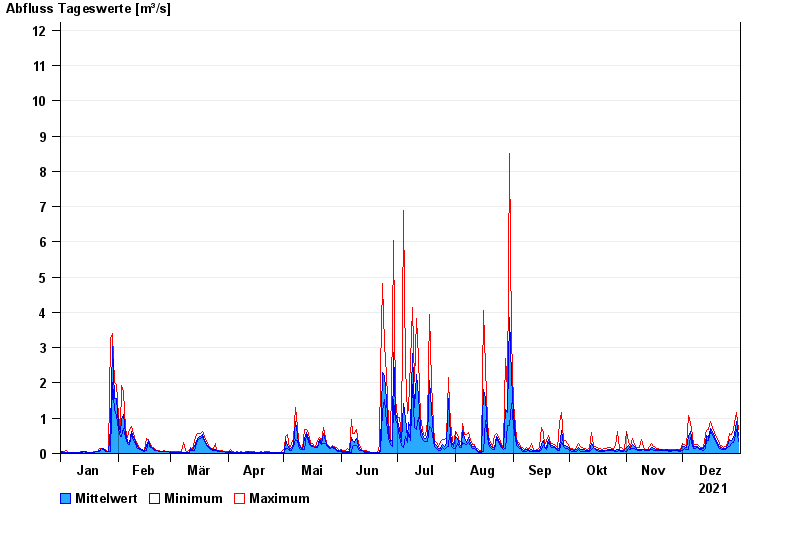
- Chart of year

Chart of year Obermühlhausen / Windach
Discharge from 01.01.2021 to 31.12.2021
- 21.05.1999 Abfluss: 25,6 m³/s
- 06.08.2000 Abfluss: 21,3 m³/s
- 02.06.2013 Abfluss: 18,8 m³/s
- 18.06.1979 Abfluss: 18,7 m³/s
- 13.04.1994 Abfluss: 16,3 m³/s
| Date | Mean value [m³/s] | Maximum [m³/s] | Minimum [m³/s] |
|---|---|---|---|
| 31.12.2021 | 0.502 | 0.674 | 0.35 |
| 30.12.2021 | 0.894 | 1.16 | 0.674 |
| 29.12.2021 | 0.535 | 0.883 | 0.393 |
| 28.12.2021 | 0.44 | 0.676 | 0.311 |
| 27.12.2021 | 0.382 | 0.531 | 0.272 |
| 26.12.2021 | 0.39 | 0.579 | 0.202 |
| 25.12.2021 | 0.215 | 0.274 | 0.17 |
© Bayerisches Landesamt für Umwelt 2024