
- Start >
- Rivers >
- Discharge >
- Isar >
- Obermühlhausen >
- Chart of year

Chart of year Obermühlhausen / Windach
Discharge from 23.09.2016 to 22.09.2017
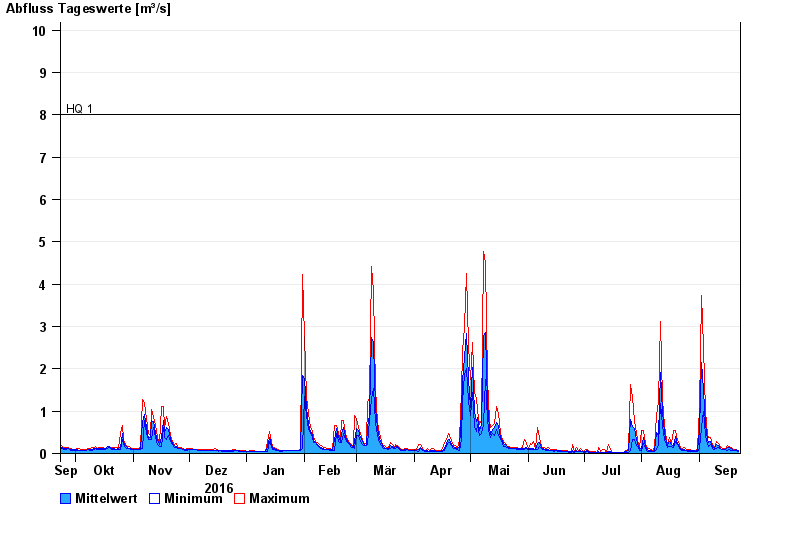
- HQ1 8 m³/s
- HQ2 10,5 m³/s
- HQ5 14 m³/s
- HQ10 17 m³/s
- HQ20 20 m³/s
- HQ50 24 m³/s
- HQ100 27 m³/s
| Date | Mean value [m³/s] | Maximum [m³/s] | Minimum [m³/s] |
|---|---|---|---|
| 22.09.2017 | 0.076 | 0.078 | 0.058 |
| 21.09.2017 | 0.088 | 0.102 | 0.078 |
| 20.09.2017 | 0.081 | 0.103 | 0.079 |
| 19.09.2017 | 0.081 | 0.104 | 0.08 |
| 18.09.2017 | 0.107 | 0.132 | 0.081 |
| 17.09.2017 | 0.143 | 0.164 | 0.105 |
| 16.09.2017 | 0.145 | 0.197 | 0.062 |
© Bayerisches Landesamt für Umwelt 2024