
- Start >
- Rivers >
- Discharge >
- Isar >
- Obermühlhausen >
- Chart of year

Chart of year Obermühlhausen / Windach
Discharge from 08.12.2019 to 07.12.2020
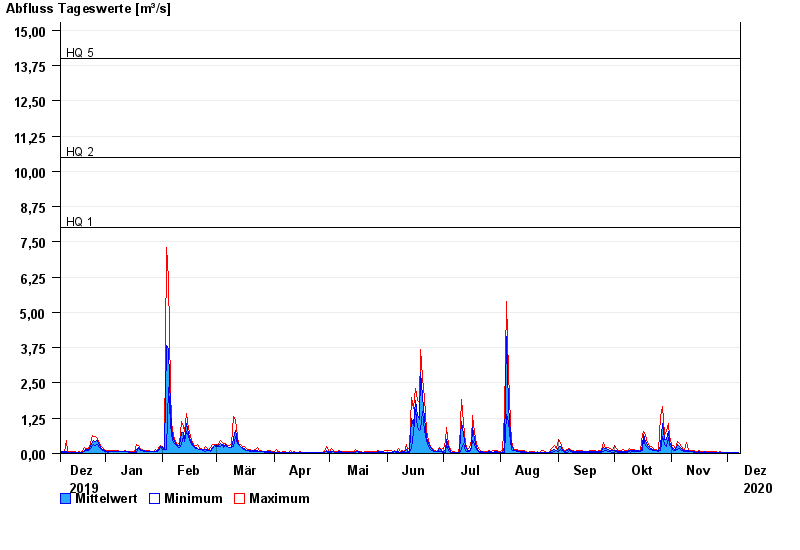
- HQ1 8 m³/s
- HQ2 10,5 m³/s
- HQ5 14 m³/s
- HQ10 17 m³/s
- HQ20 20 m³/s
- HQ50 24 m³/s
- HQ100 27 m³/s
| Date | Mean value [m³/s] | Maximum [m³/s] | Minimum [m³/s] |
|---|---|---|---|
| 07.12.2020 | 0.036 | 0.052 | 0.027 |
| 06.12.2020 | 0.029 | 0.038 | 0.019 |
| 05.12.2020 | 0.03 | 0.052 | 0.019 |
| 04.12.2020 | 0.027 | 0.038 | 0.019 |
| 03.12.2020 | 0.02 | 0.027 | 0.013 |
| 02.12.2020 | 0.024 | 0.053 | 0.013 |
| 01.12.2020 | 0.032 | 0.053 | 0.027 |
© Bayerisches Landesamt für Umwelt 2024