
- Start >
- Rivers >
- Discharge >
- Isar >
- Obermenzing >
- Chart of year

Chart of year Obermenzing / Würm
Discharge from 29.03.2024 to 28.03.2025
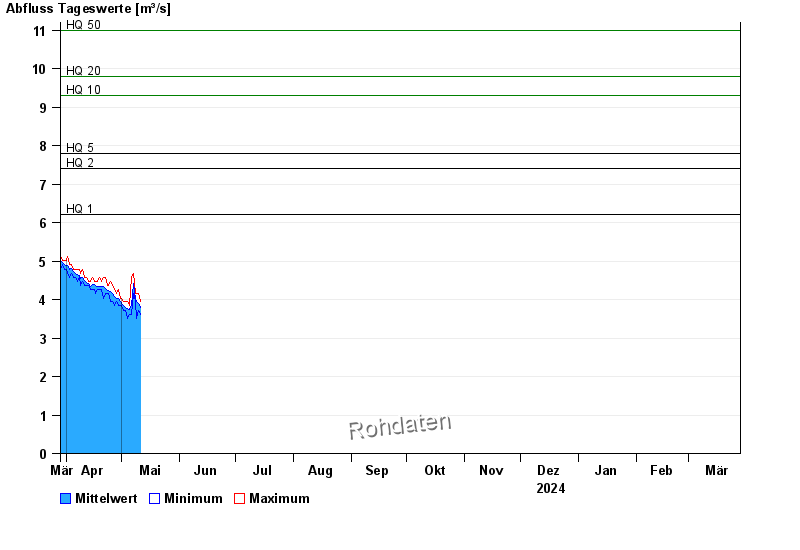
- HQ1 6,2 m³/s
- HQ2 7,4 m³/s
- HQ5 7,8 m³/s
- HQ10 9,3 m³/s
- HQ20 9,8 m³/s
- HQ50 11 m³/s
- HQ100 12,5 m³/s
| Date | Mean value [m³/s] | Maximum [m³/s] | Minimum [m³/s] |
|---|---|---|---|
| 12.05.2024 | 3.67 | 3.94 | 3.42 |
| 11.05.2024 | 3.76 | 3.94 | 3.52 |
| 10.05.2024 | 3.9 | 4.15 | 3.72 |
| 09.05.2024 | 3.94 | 4.15 | 3.52 |
| 08.05.2024 | 4.03 | 4.15 | 3.94 |
| 07.05.2024 | 4.43 | 4.68 | 4.15 |
| 06.05.2024 | 3.85 | 4.57 | 3.62 |
© Bayerisches Landesamt für Umwelt 2024