
- Start >
- Rivers >
- Discharge >
- Isar >
- Oberhausen >
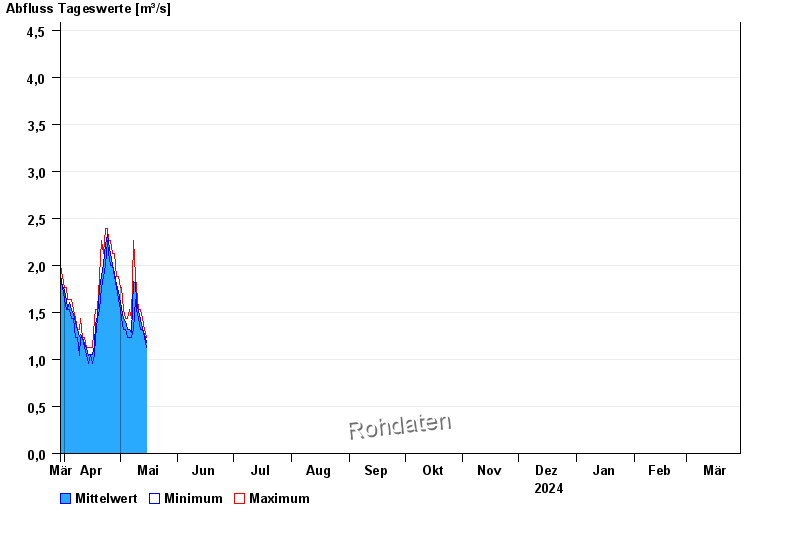
- Chart of year

Chart of year Oberhausen / Ach
Discharge from 30.03.2024 to 29.03.2025
- HQ1 16 m³/s
- HQ2 21 m³/s
- HQ5 29 m³/s
- HQ10 36 m³/s
- HQ20 43 m³/s
- HQ50 55 m³/s
- HQ100 63 m³/s
| Date | Mean value [m³/s] | Maximum [m³/s] | Minimum [m³/s] |
|---|---|---|---|
| 24.05.2024 | 1.4 | 1.43 | 1.32 |
| 23.05.2024 | 1.26 | 1.43 | 1.23 |
| 22.05.2024 | 1.28 | 1.43 | 1.23 |
| 21.05.2024 | 1.32 | 1.32 | 1.32 |
| 20.05.2024 | 1.41 | 1.76 | 1.23 |
| 19.05.2024 | 1.26 | 1.88 | 1.13 |
| 18.05.2024 | 1.11 | 1.23 | 1.04 |
© Bayerisches Landesamt für Umwelt 2024