
- Start >
- Rivers >
- Discharge >
- Isar >
- Oberhausen >
- Chart of year

Chart of year Oberhausen / Ach
Discharge from 01.01.2022 to 31.12.2022
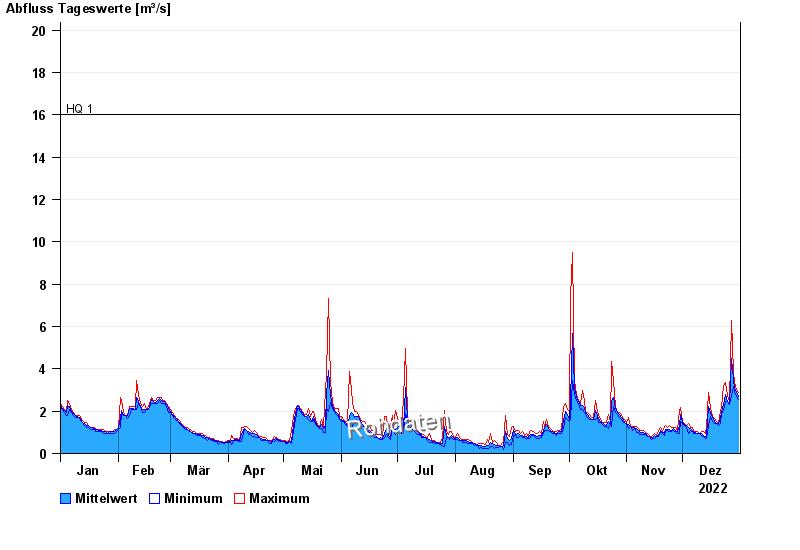
- HQ1 16 m³/s
- HQ2 21 m³/s
- HQ5 29 m³/s
- HQ10 36 m³/s
- HQ20 43 m³/s
- HQ50 55 m³/s
- HQ100 63 m³/s
| Date | Mean value [m³/s] | Maximum [m³/s] | Minimum [m³/s] |
|---|---|---|---|
| 31.12.2022 | 2.68 | 2.87 | 2.57 |
| 30.12.2022 | 2.89 | 3.02 | 2.71 |
| 29.12.2022 | 3.07 | 3.34 | 2.87 |
| 28.12.2022 | 3.49 | 3.85 | 3.18 |
| 27.12.2022 | 4.51 | 6.27 | 2.71 |
| 26.12.2022 | 2.33 | 2.44 | 2.3 |
| 25.12.2022 | 2.47 | 2.74 | 2.44 |
© Bayerisches Landesamt für Umwelt 2024