
- Start >
- Rivers >
- Discharge >
- Isar >
- Oberhausen >
- Chart of total period

Chart of total period Oberhausen / Ach
Discharge from 01.11.1950 to 26.04.2024
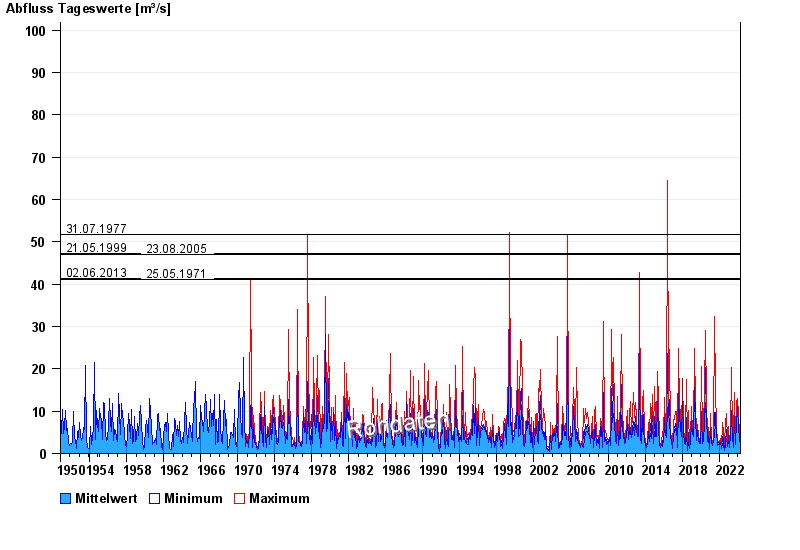
- 31.07.1977 Abfluss: 51,7 m³/s
- 21.05.1999 Abfluss: 47,2 m³/s
- 23.08.2005 Abfluss: 47,1 m³/s
- 02.06.2013 Abfluss: 41,3 m³/s
- 25.05.1971 Abfluss: 41,1 m³/s
| Date | Mean value [m³/s] | Maximum [m³/s] | Minimum [m³/s] |
|---|---|---|---|
| 26.04.2024 | 2.14 | 2.26 | 2 |
| 25.04.2024 | 2.24 | 2.26 | 2.13 |
| 24.04.2024 | 2.33 | 2.39 | 2.26 |
| 23.04.2024 | 2.22 | 2.39 | 2 |
| 22.04.2024 | 2.02 | 2.13 | 1.88 |
| 21.04.2024 | 1.88 | 2.26 | 1.76 |
| 20.04.2024 | 1.77 | 1.88 | 1.53 |
© Bayerisches Landesamt für Umwelt 2024