

Chart of year Oberding / Gfällach
Discharge from 24.09.2020 to 23.09.2021
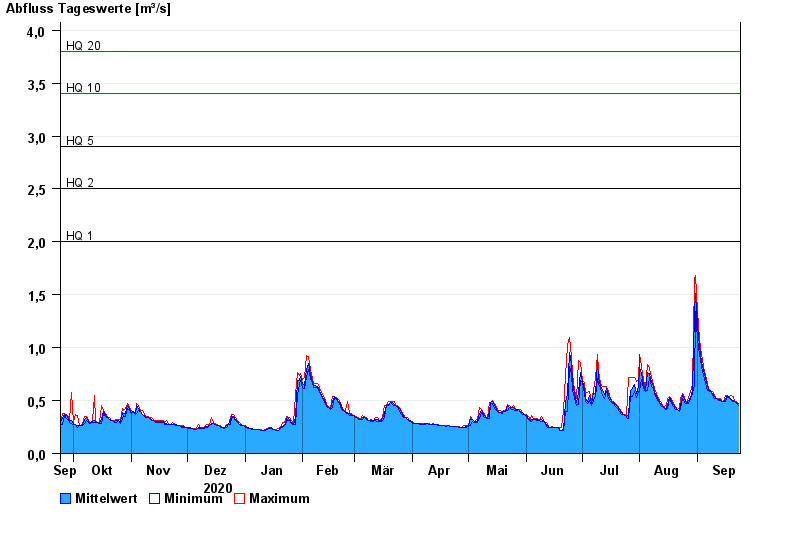
- HQ1 2 m³/s
- HQ2 2,5 m³/s
- HQ5 2,9 m³/s
- HQ10 3,4 m³/s
- HQ20 3,8 m³/s
- HQ50 4,4 m³/s
- HQ100 4,9 m³/s
| Date | Mean value [m³/s] | Maximum [m³/s] | Minimum [m³/s] |
|---|---|---|---|
| 23.09.2021 | 0.469 | 0.472 | 0.457 |
| 22.09.2021 | 0.481 | 0.488 | 0.472 |
| 21.09.2021 | 0.488 | 0.488 | 0.487 |
| 20.09.2021 | 0.503 | 0.535 | 0.487 |
| 19.09.2021 | 0.511 | 0.55 | 0.503 |
| 18.09.2021 | 0.528 | 0.534 | 0.519 |
| 17.09.2021 | 0.547 | 0.55 | 0.534 |
© Bayerisches Landesamt für Umwelt 2024