

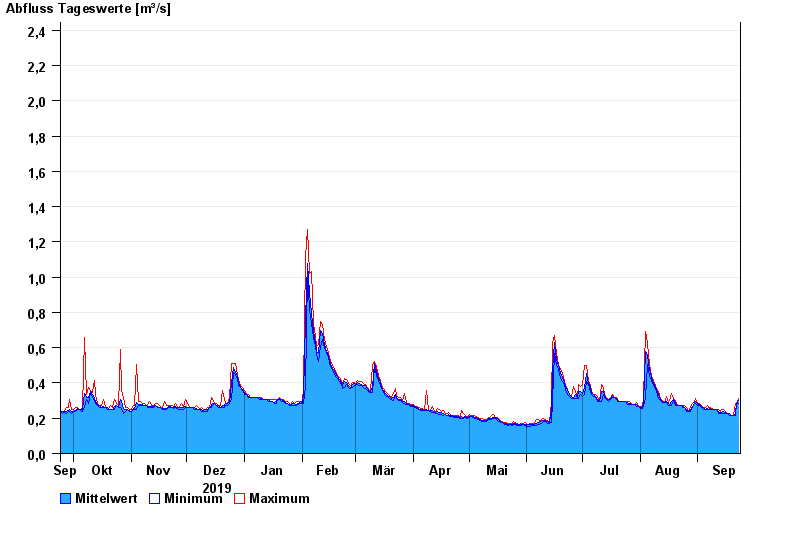
Chart of year Oberding / Gfällach
Discharge from 24.09.2019 to 23.09.2020
- 03.06.2013 Abfluss: 6,03 m³/s
- 07.06.1995 Abfluss: 5,13 m³/s
- 18.06.1979 Abfluss: 3,73 m³/s
- 07.08.2002 Abfluss: 3,46 m³/s
- 17.11.1973 Abfluss: 3,27 m³/s
| Date | Mean value [m³/s] | Maximum [m³/s] | Minimum [m³/s] |
|---|---|---|---|
| 23.09.2020 | 0.298 | 0.31 | 0.284 |
| 22.09.2020 | 0.284 | 0.284 | 0.284 |
| 21.09.2020 | 0.228 | 0.284 | 0.218 |
| 20.09.2020 | 0.218 | 0.218 | 0.218 |
| 19.09.2020 | 0.218 | 0.218 | 0.218 |
| 18.09.2020 | 0.224 | 0.228 | 0.218 |
| 17.09.2020 | 0.228 | 0.228 | 0.228 |
© Bayerisches Landesamt für Umwelt 2024