

Chart of year Oberding / Gfällach
Discharge from 22.10.2020 to 21.10.2021
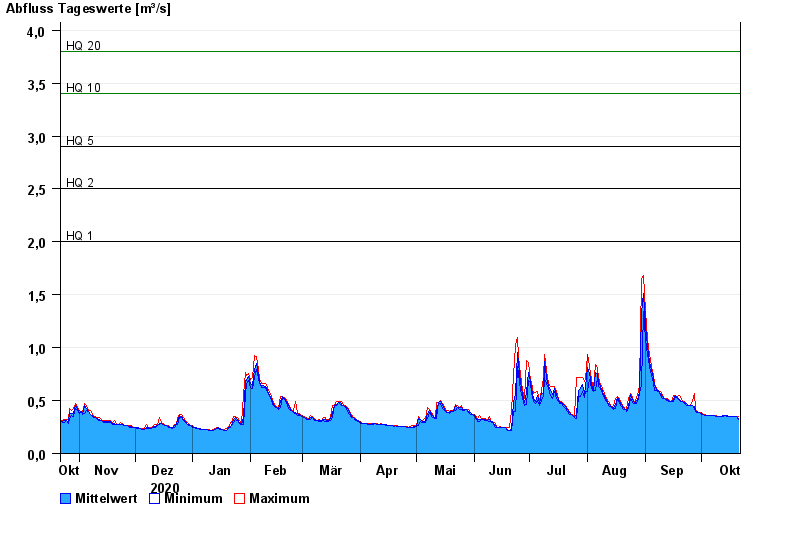
- HQ1 2 m³/s
- HQ2 2,5 m³/s
- HQ5 2,9 m³/s
- HQ10 3,4 m³/s
- HQ20 3,8 m³/s
- HQ50 4,4 m³/s
- HQ100 4,9 m³/s
| Date | Mean value [m³/s] | Maximum [m³/s] | Minimum [m³/s] |
|---|---|---|---|
| 21.10.2021 | 0.333 | 0.346 | 0.32 |
| 20.10.2021 | 0.346 | 0.346 | 0.346 |
| 19.10.2021 | 0.346 | 0.346 | 0.346 |
| 18.10.2021 | 0.346 | 0.346 | 0.345 |
| 17.10.2021 | 0.345 | 0.345 | 0.345 |
| 16.10.2021 | 0.345 | 0.345 | 0.345 |
| 15.10.2021 | 0.357 | 0.359 | 0.345 |
© Bayerisches Landesamt für Umwelt 2024