
- Start >
- Rivers >
- Discharge >
- Isar >
- Oberammergau >
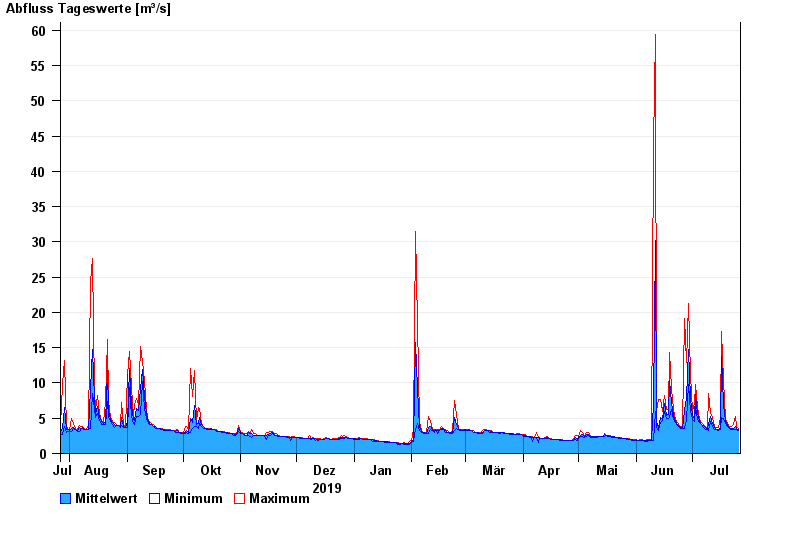
- Chart of year

Chart of year Oberammergau / Ammer
Discharge from 27.07.2019 to 26.07.2020
| Date | Mean value [m³/s] | Maximum [m³/s] | Minimum [m³/s] |
|---|---|---|---|
| 26.07.2020 | 3.4 | 3.61 | 3.2 |
| 25.07.2020 | 3.57 | 3.83 | 3.4 |
| 24.07.2020 | 3.88 | 5.29 | 3.4 |
| 23.07.2020 | 3.55 | 4.05 | 3.4 |
| 22.07.2020 | 3.56 | 3.83 | 3.4 |
| 21.07.2020 | 3.66 | 3.83 | 3.61 |
| 20.07.2020 | 3.97 | 4.29 | 3.83 |
© Bayerisches Landesamt für Umwelt 2024