
- Start >
- Rivers >
- Discharge >
- Isar >
- Oberammergau >
- Chart of year

Chart of year Oberammergau / Ammer
Discharge from 01.01.2022 to 31.12.2022
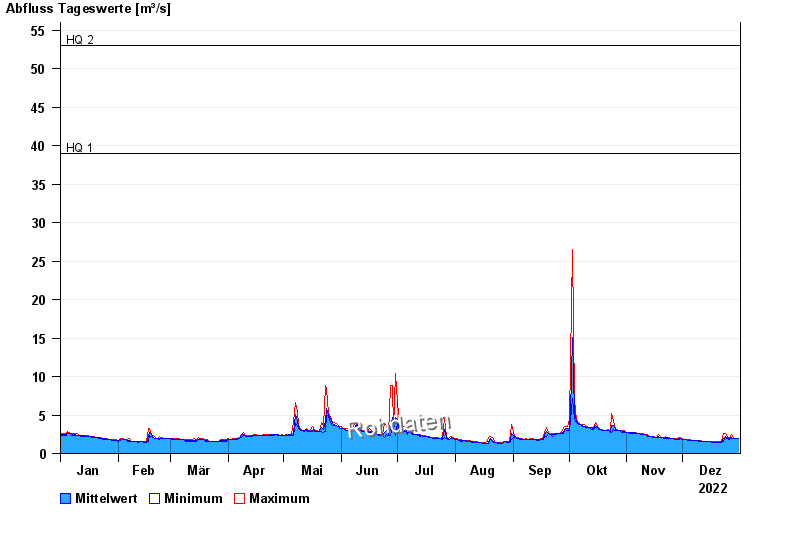
- HQ1 39 m³/s
- HQ2 53 m³/s
- HQ5 73 m³/s
- HQ10 90 m³/s
- HQ20 110 m³/s
- HQ50 135 m³/s
- HQ100 160 m³/s
| Date | Mean value [m³/s] | Maximum [m³/s] | Minimum [m³/s] |
|---|---|---|---|
| 31.12.2022 | 1.92 | 1.92 | 1.92 |
| 30.12.2022 | 1.92 | 1.92 | 1.92 |
| 29.12.2022 | 1.92 | 1.92 | 1.92 |
| 28.12.2022 | 1.95 | 2.08 | 1.92 |
| 27.12.2022 | 2.14 | 2.41 | 1.92 |
| 26.12.2022 | 1.93 | 2.08 | 1.77 |
| 25.12.2022 | 2.14 | 2.24 | 1.92 |
© Bayerisches Landesamt für Umwelt 2024