
- Start >
- Rivers >
- Discharge >
- Isar >
- Oberammergau >
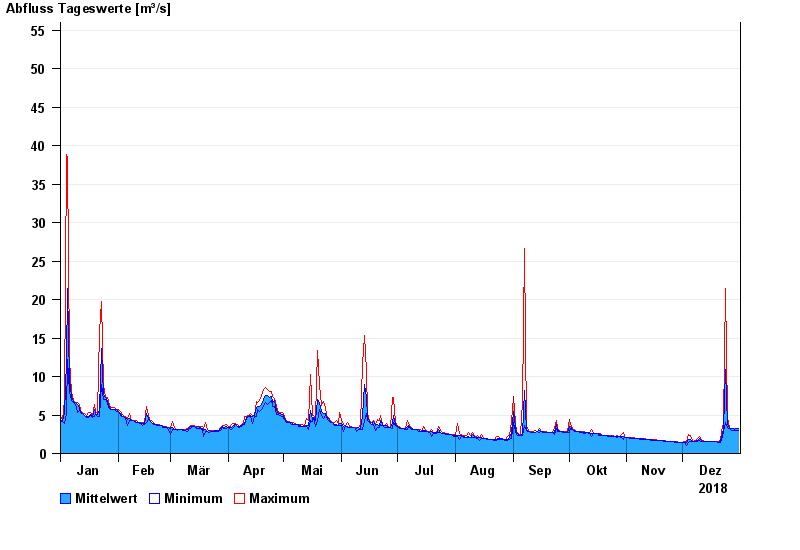
- Chart of year

Chart of year Oberammergau / Ammer
Discharge from 01.01.2018 to 31.12.2018
- 23.08.2005 Abfluss: 181 m³/s
- 22.05.1999 Abfluss: 168 m³/s
- 23.07.1966 Abfluss: 135 m³/s
- 14.06.1959 Abfluss: 126 m³/s
- 12.08.2002 Abfluss: 125 m³/s
| Date | Mean value [m³/s] | Maximum [m³/s] | Minimum [m³/s] |
|---|---|---|---|
| 31.12.2018 | 3.2 | 3.23 | 3.04 |
| 30.12.2018 | 3.2 | 3.22 | 3.04 |
| 29.12.2018 | 3.09 | 3.22 | 3.03 |
| 28.12.2018 | 3.21 | 3.22 | 3.03 |
| 27.12.2018 | 3.21 | 3.22 | 3.03 |
| 26.12.2018 | 3.23 | 3.41 | 3.22 |
| 25.12.2018 | 3.82 | 4.65 | 3.41 |
© Bayerisches Landesamt für Umwelt 2024