
- Start >
- Rivers >
- Discharge >
- Isar >
- Oberammergau >
- Chart of year

Chart of year Oberammergau / Ammer
Discharge from 01.08.2021 to 31.07.2022
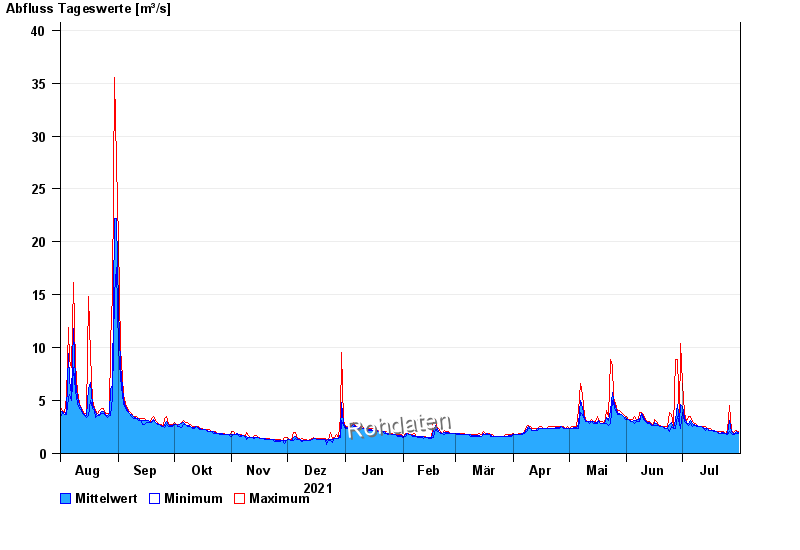
| Date | Mean value [m³/s] | Maximum [m³/s] | Minimum [m³/s] |
|---|---|---|---|
| 31.07.2022 | 1.94 | 2.06 | 1.91 |
| 30.07.2022 | 2.05 | 2.21 | 1.91 |
| 29.07.2022 | 1.85 | 2.06 | 1.77 |
| 28.07.2022 | 1.91 | 1.91 | 1.77 |
| 27.07.2022 | 2.09 | 2.21 | 1.91 |
| 26.07.2022 | 3.13 | 4.54 | 2.04 |
| 25.07.2022 | 1.9 | 2.19 | 1.76 |
© Bayerisches Landesamt für Umwelt 2024