
- Start >
- Rivers >
- Discharge >
- Isar >
- Oberammergau >
- Chart of year

Chart of year Oberammergau / Ammer
Discharge from 15.08.2019 to 14.08.2020
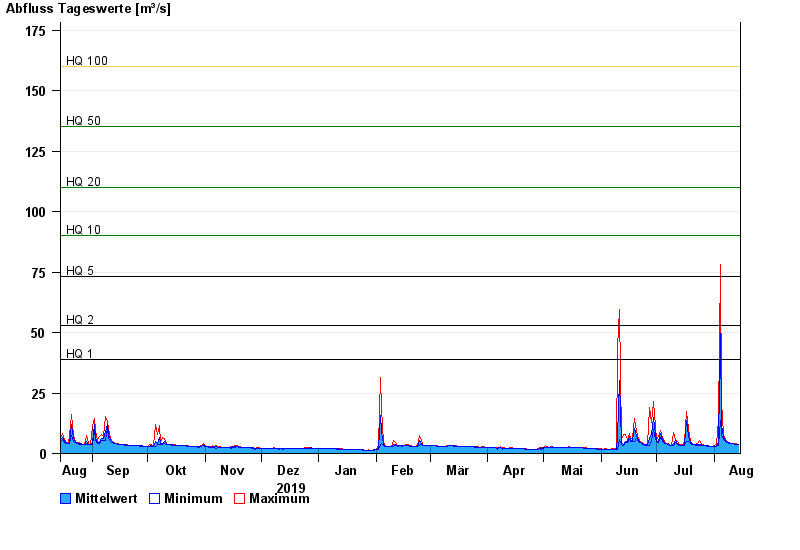
- HQ1 39 m³/s
- HQ2 53 m³/s
- HQ5 73 m³/s
- HQ10 90 m³/s
- HQ20 110 m³/s
- HQ50 135 m³/s
- HQ100 160 m³/s
| Date | Mean value [m³/s] | Maximum [m³/s] | Minimum [m³/s] |
|---|---|---|---|
| 14.08.2020 | 3.74 | 3.8 | 3.58 |
| 13.08.2020 | 3.84 | 4.03 | 3.59 |
| 12.08.2020 | 3.87 | 4.03 | 3.8 |
| 11.08.2020 | 4.04 | 4.26 | 4.03 |
| 10.08.2020 | 4.25 | 4.27 | 4.03 |
| 09.08.2020 | 4.37 | 4.51 | 4.27 |
| 08.08.2020 | 4.66 | 5.01 | 4.51 |
© Bayerisches Landesamt für Umwelt 2024