

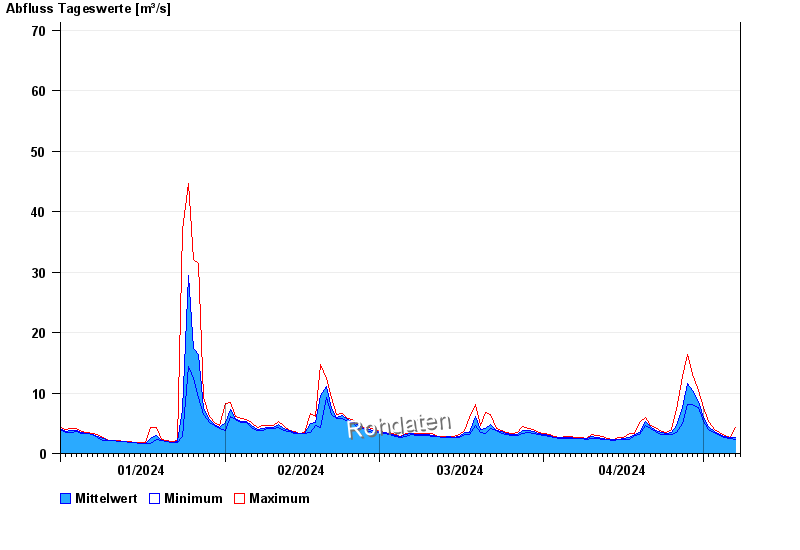
Chart of year Oberach / Weißach
Discharge from 01.01.2024 to 07.05.2024
- 21.05.1999 Abfluss: 173 m³/s
- 02.06.2013 Abfluss: 165 m³/s
- 23.08.2005 Abfluss: 154 m³/s
- 03.06.2010 Abfluss: 150 m³/s
- 12.08.2002 Abfluss: 116 m³/s
| Date | Mean value [m³/s] | Maximum [m³/s] | Minimum [m³/s] |
|---|---|---|---|
| 07.05.2024 | 2.51 | 2.51 | 2.51 |
| 06.05.2024 | 2.6 | 2.68 | 2.51 |
| 05.05.2024 | 2.84 | 3.03 | 2.68 |
| 04.05.2024 | 3.21 | 3.41 | 3.03 |
| 03.05.2024 | 3.56 | 4.05 | 3.41 |
| 02.05.2024 | 4.43 | 5.26 | 4.05 |
| 01.05.2024 | 5.92 | 7.53 | 5.26 |
© Bayerisches Landesamt für Umwelt 2024