

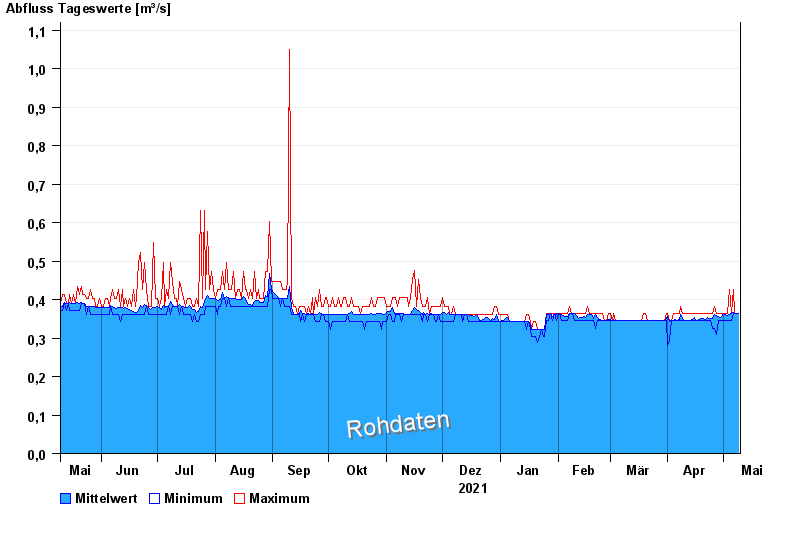
Chart of year Mühltal / Glonn
Discharge from 10.05.2021 to 09.05.2022
- 11.08.2002 Abfluss: 7,17 m³/s
- 01.08.2002 Abfluss: 1,43 m³/s
- 16.08.1988 Abfluss: 1,43 m³/s
- 09.09.1979 Abfluss: 1,39 m³/s
- 13.04.1994 Abfluss: 1,15 m³/s
| Date | Mean value [m³/s] | Maximum [m³/s] | Minimum [m³/s] |
|---|---|---|---|
| 09.05.2022 | 0.363 | 0.363 | 0.363 |
| 08.05.2022 | 0.363 | 0.363 | 0.363 |
| 07.05.2022 | 0.363 | 0.363 | 0.363 |
| 06.05.2022 | 0.366 | 0.427 | 0.363 |
| 05.05.2022 | 0.363 | 0.363 | 0.345 |
| 04.05.2022 | 0.36 | 0.427 | 0.345 |
| 03.05.2022 | 0.359 | 0.363 | 0.345 |
© Bayerisches Landesamt für Umwelt 2024