

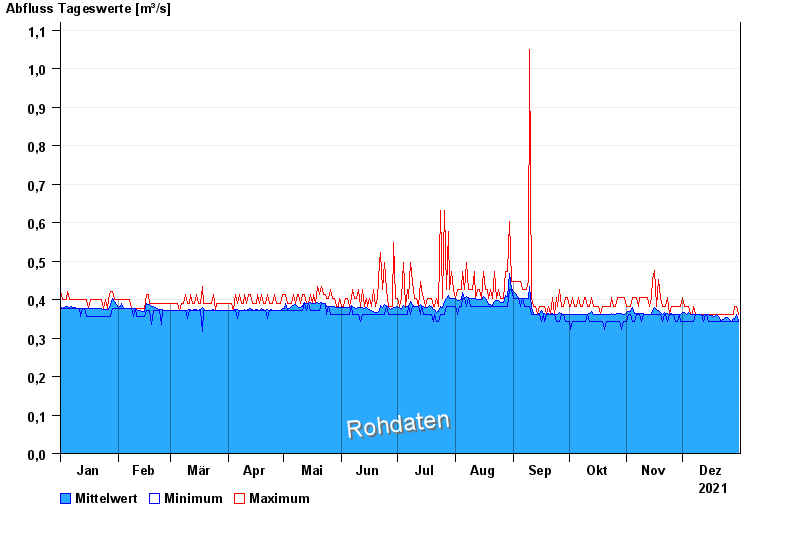
Chart of year Mühltal / Glonn
Discharge from 01.01.2021 to 31.12.2021
- 11.08.2002 Abfluss: 7,17 m³/s
- 01.08.2002 Abfluss: 1,43 m³/s
- 16.08.1988 Abfluss: 1,43 m³/s
- 09.09.1979 Abfluss: 1,39 m³/s
- 13.04.1994 Abfluss: 1,15 m³/s
| Date | Mean value [m³/s] | Maximum [m³/s] | Minimum [m³/s] |
|---|---|---|---|
| 31.12.2021 | 0.346 | 0.361 | 0.342 |
| 30.12.2021 | 0.361 | 0.383 | 0.342 |
| 29.12.2021 | 0.348 | 0.383 | 0.342 |
| 28.12.2021 | 0.351 | 0.361 | 0.342 |
| 27.12.2021 | 0.342 | 0.361 | 0.342 |
| 26.12.2021 | 0.348 | 0.361 | 0.342 |
| 25.12.2021 | 0.353 | 0.361 | 0.342 |
© Bayerisches Landesamt für Umwelt 2024