

Chart of year Mühltal / Glonn
Discharge from 01.01.2014 to 31.12.2014
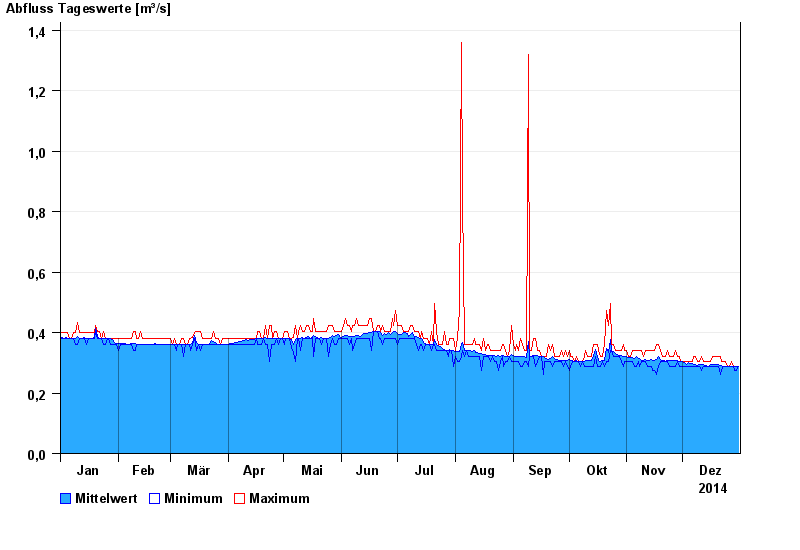
| Date | Mean value [m³/s] | Maximum [m³/s] | Minimum [m³/s] |
|---|---|---|---|
| 31.12.2014 | 0.289 | 0.289 | 0.289 |
| 30.12.2014 | 0.289 | 0.289 | 0.274 |
| 29.12.2014 | 0.288 | 0.289 | 0.274 |
| 28.12.2014 | 0.289 | 0.289 | 0.289 |
| 27.12.2014 | 0.289 | 0.305 | 0.289 |
| 26.12.2014 | 0.289 | 0.289 | 0.289 |
| 25.12.2014 | 0.289 | 0.289 | 0.289 |
© Bayerisches Landesamt für Umwelt 2024