

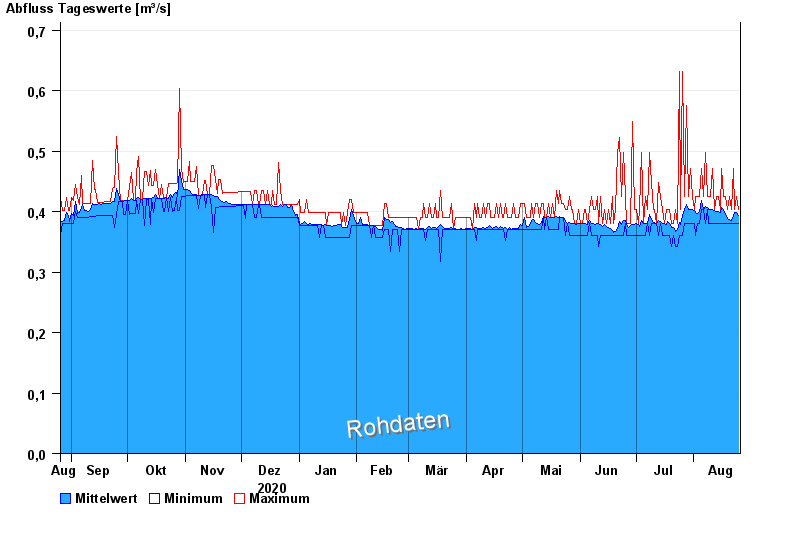
Chart of year Mühltal / Glonn
Discharge from 26.08.2020 to 25.08.2021
- 11.08.2002 Abfluss: 7,17 m³/s
- 01.08.2002 Abfluss: 1,43 m³/s
- 16.08.1988 Abfluss: 1,43 m³/s
- 09.09.1979 Abfluss: 1,39 m³/s
- 13.04.1994 Abfluss: 1,15 m³/s
| Date | Mean value [m³/s] | Maximum [m³/s] | Minimum [m³/s] |
|---|---|---|---|
| 25.08.2021 | 0.393 | 0.403 | 0.381 |
| 24.08.2021 | 0.398 | 0.425 | 0.381 |
| 23.08.2021 | 0.398 | 0.403 | 0.381 |
| 22.08.2021 | 0.394 | 0.472 | 0.381 |
| 21.08.2021 | 0.385 | 0.403 | 0.381 |
| 20.08.2021 | 0.387 | 0.425 | 0.381 |
| 19.08.2021 | 0.388 | 0.403 | 0.381 |
© Bayerisches Landesamt für Umwelt 2024