
- Start >
- Rivers >
- Discharge >
- Isar >
- Mühlhausen >
- Chart of total period

Chart of total period Mühlhausen / Euzenauer Bach
Discharge from 01.11.1950 to 26.04.2024
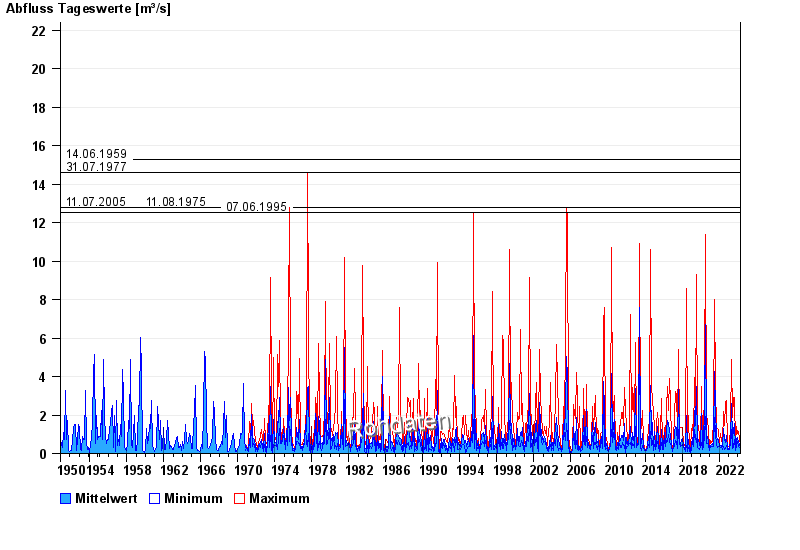
- 14.06.1959 Abfluss: 15,3 m³/s
- 31.07.1977 Abfluss: 14,6 m³/s
- 11.07.2005 Abfluss: 12,8 m³/s
- 11.08.1975 Abfluss: 12,8 m³/s
- 07.06.1995 Abfluss: 12,5 m³/s
| Date | Mean value [m³/s] | Maximum [m³/s] | Minimum [m³/s] |
|---|---|---|---|
| 26.04.2024 | 0.251 | 0.344 | 0.167 |
| 25.04.2024 | 0.212 | 0.247 | 0.167 |
| 24.04.2024 | 0.198 | 0.218 | 0.192 |
| 23.04.2024 | 0.197 | 0.218 | 0.167 |
| 22.04.2024 | 0.206 | 0.247 | 0.192 |
| 21.04.2024 | 0.199 | 0.247 | 0.145 |
| 20.04.2024 | 0.196 | 0.247 | 0.145 |
© Bayerisches Landesamt für Umwelt 2024