

Chart of year Moosburg / Isar
Discharge from 18.10.2021 to 17.10.2022
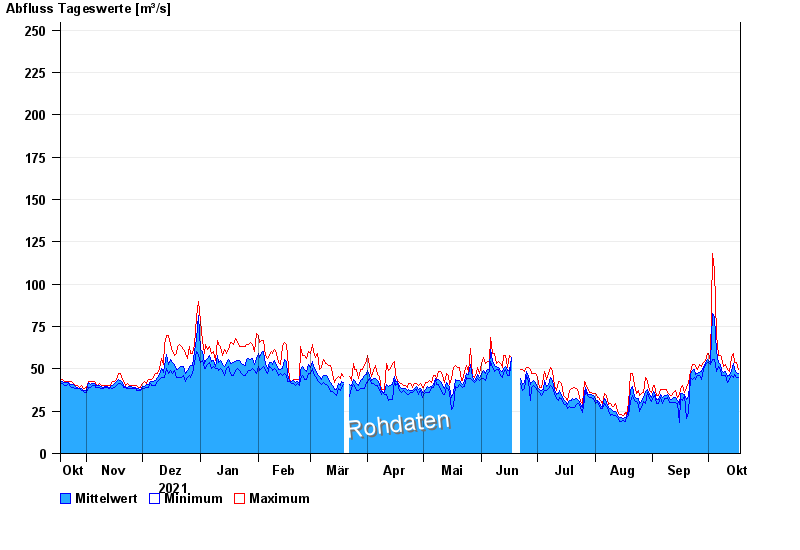 Für diesen Pegel sind keine Jährlichkeiten hinterlegt.
| Date | Mean value [m³/s] | Maximum [m³/s] | Minimum [m³/s] |
|---|---|---|---|
| 17.10.2022 | 47.5 | 49.6 | 44.9 |
| 16.10.2022 | 47.8 | 53.7 | 44.9 |
| 15.10.2022 | 49.8 | 53.7 | 46.8 |
| 14.10.2022 | 53.4 | 59 | 44.9 |
| 13.10.2022 | 48.3 | 56.8 | 45.8 |
| 12.10.2022 | 46 | 48.7 | 43.9 |
| 11.10.2022 | 45.6 | 49.6 | 42.1 |
© Bayerisches Landesamt für Umwelt 2024