

Chart of year Moosburg / Isar
Discharge from 01.01.2024 to 27.04.2024
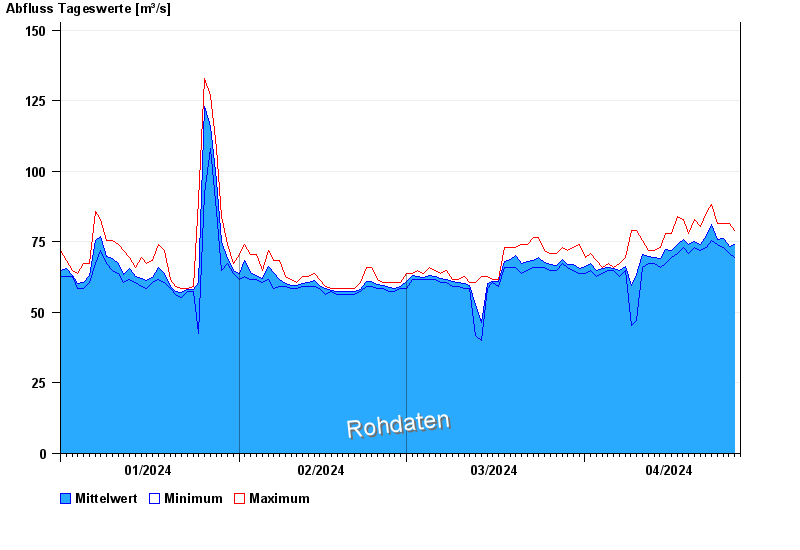
| Date | Mean value [m³/s] | Maximum [m³/s] | Minimum [m³/s] |
|---|---|---|---|
| 27.04.2024 | 73.7 | 75.4 | 71.8 |
| 26.04.2024 | 73.5 | 81.6 | 70.7 |
| 25.04.2024 | 76.1 | 81.6 | 73 |
| 24.04.2024 | 76 | 81.6 | 74.2 |
| 23.04.2024 | 81.1 | 88.1 | 75.4 |
| 22.04.2024 | 77.1 | 85.5 | 73 |
| 21.04.2024 | 74 | 80.4 | 71.8 |
© Bayerisches Landesamt für Umwelt 2024