
- Start >
- Rivers >
- Discharge >
- Isar >
- Mittenwald >
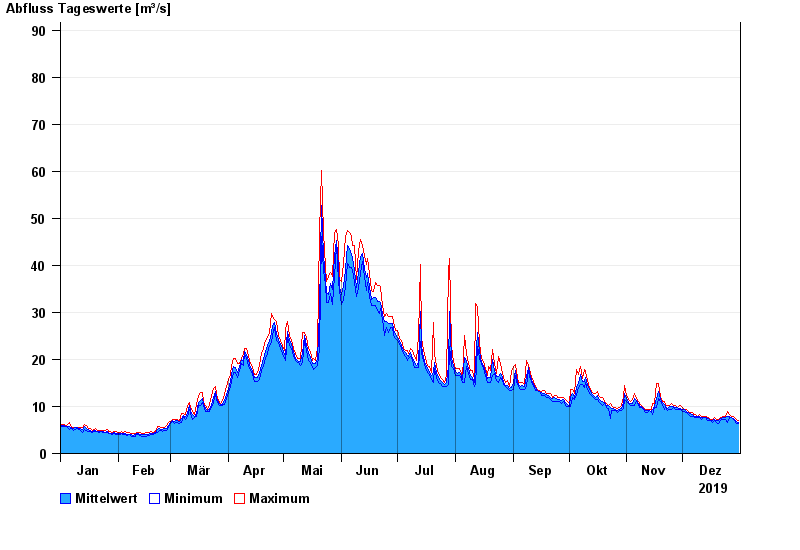
- Chart of year

Chart of year Mittenwald / Isar
Discharge from 01.01.2019 to 31.12.2019
- 23.08.2005 Abfluss: 203 m³/s
- 10.08.1970 Abfluss: 163 m³/s
- 22.05.1999 Abfluss: 160 m³/s
- 14.06.1910 Abfluss: 150 m³/s
- 01.07.1966 Abfluss: 133 m³/s
| Date | Mean value [m³/s] | Maximum [m³/s] | Minimum [m³/s] |
|---|---|---|---|
| 31.12.2019 | 6.61 | 6.91 | 6.3 |
| 30.12.2019 | 6.79 | 7.23 | 6.3 |
| 29.12.2019 | 7.13 | 7.56 | 6.91 |
| 28.12.2019 | 7.49 | 7.9 | 7.23 |
| 27.12.2019 | 7.74 | 7.9 | 7.56 |
| 26.12.2019 | 7.84 | 8.25 | 7.57 |
| 25.12.2019 | 7.86 | 8.97 | 6.61 |
© Bayerisches Landesamt für Umwelt 2024