

Chart of year Mering / Paar
Discharge from 12.07.2021 to 11.07.2022
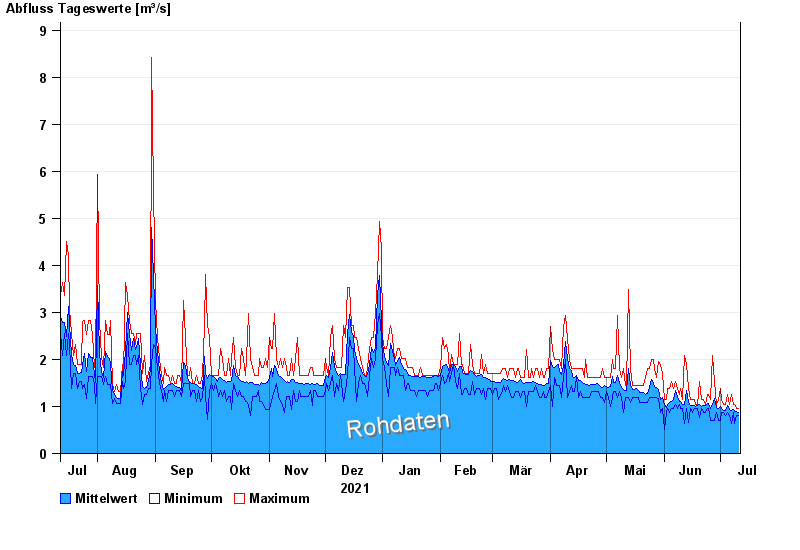
| Date | Mean value [m³/s] | Maximum [m³/s] | Minimum [m³/s] |
|---|---|---|---|
| 11.07.2022 | 0.875 | 0.954 | 0.813 |
| 10.07.2022 | 0.888 | 0.954 | 0.813 |
| 09.07.2022 | 0.886 | 1.04 | 0.628 |
| 08.07.2022 | 0.925 | 1.04 | 0.879 |
| 07.07.2022 | 0.92 | 1.26 | 0.628 |
| 06.07.2022 | 0.931 | 1.04 | 0.813 |
| 05.07.2022 | 1.03 | 1.26 | 0.879 |
© Bayerisches Landesamt für Umwelt 2024