

Chart of year Mering / Paar
Discharge from 12.07.2019 to 11.07.2020
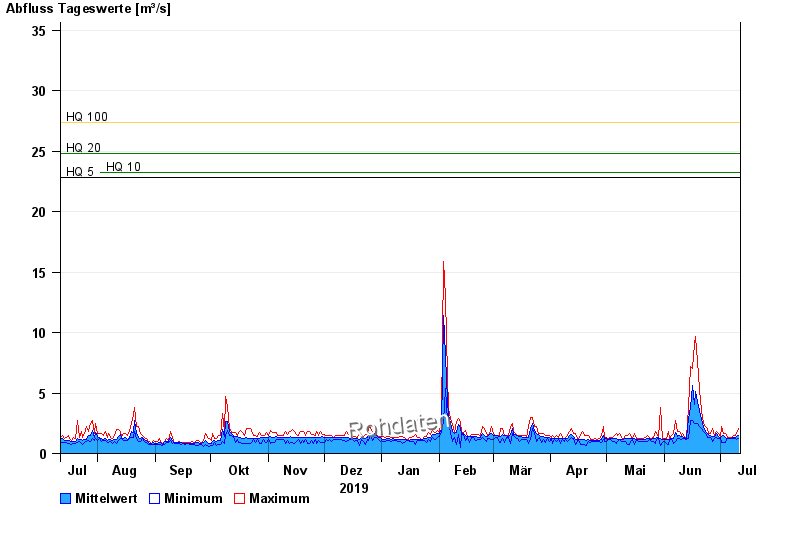
- HQ5 22,8 m³/s
- HQ10 23,2 m³/s
- HQ20 24,8 m³/s
- HQ100 27,4 m³/s
| Date | Mean value [m³/s] | Maximum [m³/s] | Minimum [m³/s] |
|---|---|---|---|
| 11.07.2020 | 1.5 | 2.05 | 1.23 |
| 10.07.2020 | 1.39 | 1.67 | 1.12 |
| 09.07.2020 | 1.36 | 1.51 | 1.23 |
| 08.07.2020 | 1.36 | 1.51 | 1.23 |
| 07.07.2020 | 1.26 | 1.36 | 1.23 |
| 06.07.2020 | 1.28 | 1.36 | 1.23 |
| 05.07.2020 | 1.27 | 1.36 | 1.23 |
© Bayerisches Landesamt für Umwelt 2024