

Chart of year Mering / Paar
Discharge from 02.04.2020 to 01.04.2021
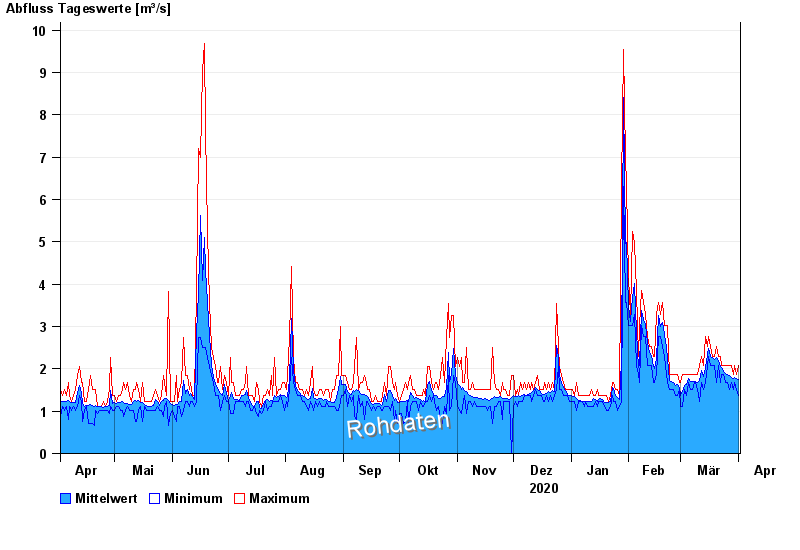
| Date | Mean value [m³/s] | Maximum [m³/s] | Minimum [m³/s] |
|---|---|---|---|
| 01.04.2021 | 1.74 | 2.07 | 1.36 |
| 31.03.2021 | 1.78 | 1.87 | 1.51 |
| 30.03.2021 | 1.8 | 2.07 | 1.68 |
| 29.03.2021 | 1.77 | 1.87 | 1.51 |
| 28.03.2021 | 1.8 | 2.07 | 1.68 |
| 27.03.2021 | 1.84 | 2.07 | 1.51 |
| 26.03.2021 | 1.87 | 2.07 | 1.68 |
© Bayerisches Landesamt für Umwelt 2024