

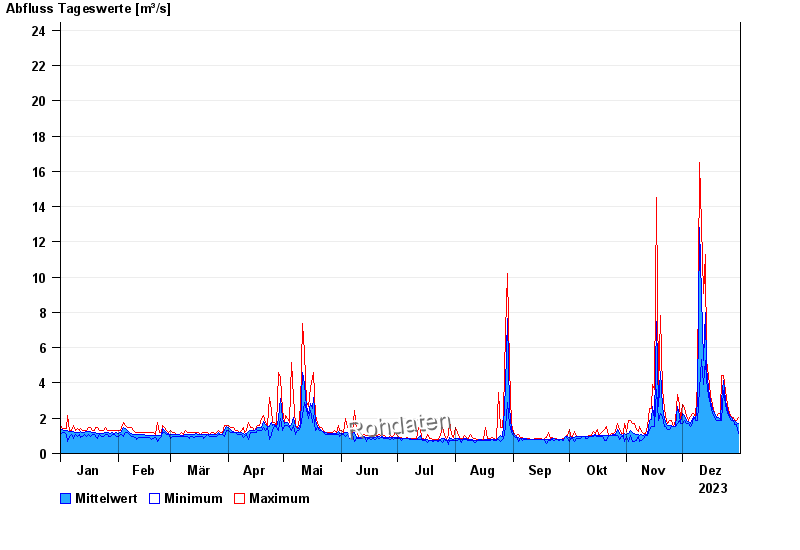
Chart of year Mering / Paar
Discharge from 01.01.2023 to 31.12.2023
- 30.05.1940 Abfluss: 50 m³/s
- 03.08.1968 Abfluss: 37 m³/s
- 11.09.1967 Abfluss: 36 m³/s
- 22.05.1999 Abfluss: 34,9 m³/s
- 12.08.2002 Abfluss: 30,3 m³/s
| Date | Mean value [m³/s] | Maximum [m³/s] | Minimum [m³/s] |
|---|---|---|---|
| 31.12.2023 | 1.69 | 2.05 | 1.12 |
| 30.12.2023 | 1.77 | 1.85 | 1.67 |
| 29.12.2023 | 1.85 | 1.85 | 1.67 |
| 28.12.2023 | 1.85 | 2.05 | 1.85 |
| 27.12.2023 | 2.02 | 2.05 | 1.85 |
| 26.12.2023 | 2.16 | 2.26 | 2.05 |
| 25.12.2023 | 2.49 | 2.75 | 2.26 |
© Bayerisches Landesamt für Umwelt 2024