

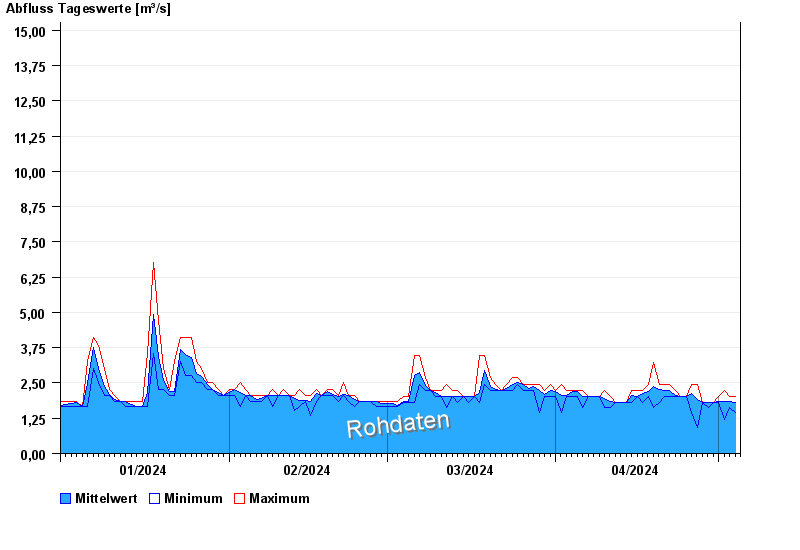
Chart of year Mering / Paar
Discharge from 01.01.2024 to 04.05.2024
- HQ5 22,8 m³/s
- HQ10 23,2 m³/s
- HQ20 24,8 m³/s
- HQ100 27,4 m³/s
| Date | Mean value [m³/s] | Maximum [m³/s] | Minimum [m³/s] |
|---|---|---|---|
| 04.05.2024 | 1.81 | 2.01 | 1.47 |
| 03.05.2024 | 1.84 | 2.01 | 1.64 |
| 02.05.2024 | 1.84 | 2.22 | 1.21 |
| 01.05.2024 | 1.83 | 2.01 | 1.82 |
| 30.04.2024 | 1.82 | 1.82 | 1.82 |
| 29.04.2024 | 1.82 | 1.82 | 1.64 |
| 28.04.2024 | 1.82 | 1.82 | 1.82 |
© Bayerisches Landesamt für Umwelt 2024