
- Start >
- Rivers >
- Discharge >
- Isar >
- Manching (Ort) >
- Chart of year

Chart of year Manching (Ort) / Paar
Discharge from 01.01.2024 to 31.12.2024
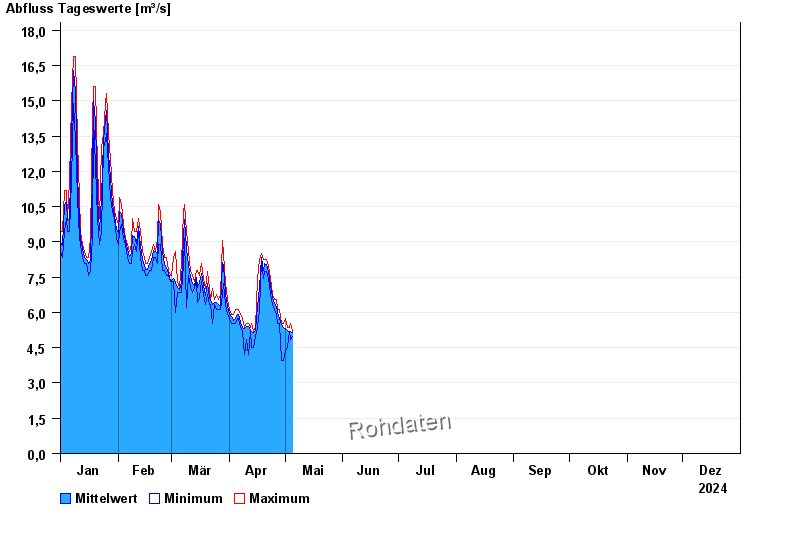
| Date | Mean value [m³/s] | Maximum [m³/s] | Minimum [m³/s] |
|---|---|---|---|
| 16.05.2024 | 4.99 | 4.99 | 4.99 |
| 15.05.2024 | 4.96 | 5.93 | 3.7 |
| 14.05.2024 | 4.96 | 5.17 | 3.82 |
| 13.05.2024 | 5.01 | 5.54 | 3.7 |
| 12.05.2024 | 5.16 | 5.35 | 4.68 |
| 11.05.2024 | 5.26 | 5.35 | 4.68 |
| 10.05.2024 | 5.44 | 5.72 | 4.68 |
© Bayerisches Landesamt für Umwelt 2024