
- Start >
- Rivers >
- Discharge >
- Isar >
- Manching (Ort) >
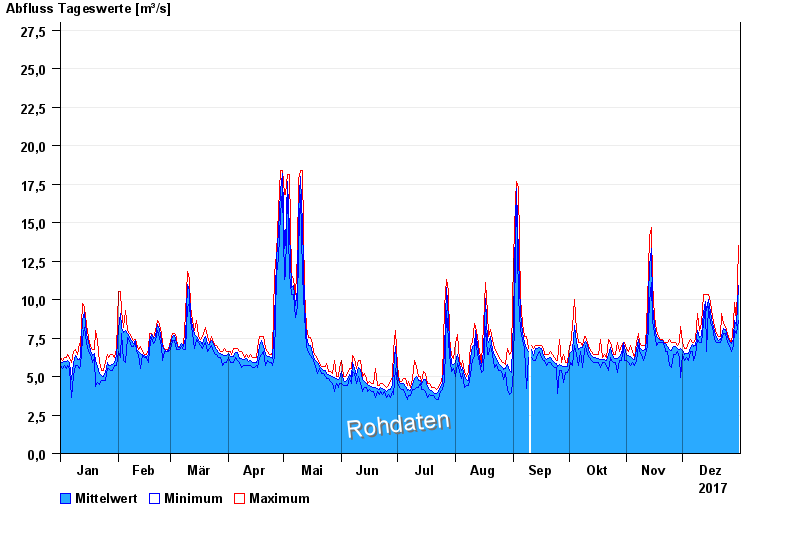
- Chart of year

Chart of year Manching (Ort) / Paar
Discharge from 01.01.2017 to 31.12.2017
- 04.06.2013 Abfluss: 77,3 m³/s
- 11.03.2006 Abfluss: 76,4 m³/s
- 15.04.1994 Abfluss: 75,5 m³/s
- 17.02.2006 Abfluss: 53,8 m³/s
- 24.05.1999 Abfluss: 52,4 m³/s
| Date | Mean value [m³/s] | Maximum [m³/s] | Minimum [m³/s] |
|---|---|---|---|
| 31.12.2017 | 10.9 | 13.5 | 8.66 |
| 30.12.2017 | 8.3 | 8.66 | 7.8 |
| 29.12.2017 | 8.67 | 9.82 | 8.01 |
| 28.12.2017 | 7.48 | 8.43 | 7 |
| 27.12.2017 | 7.13 | 7.19 | 6.62 |
| 26.12.2017 | 7.25 | 7.4 | 7 |
| 25.12.2017 | 7.58 | 7.8 | 7.19 |
© Bayerisches Landesamt für Umwelt 2024