
- Start >
- Rivers >
- Discharge >
- Isar >
- Leutstetten >
- Chart of year

Chart of year Leutstetten / Würm
Discharge from 03.06.2020 to 02.06.2021
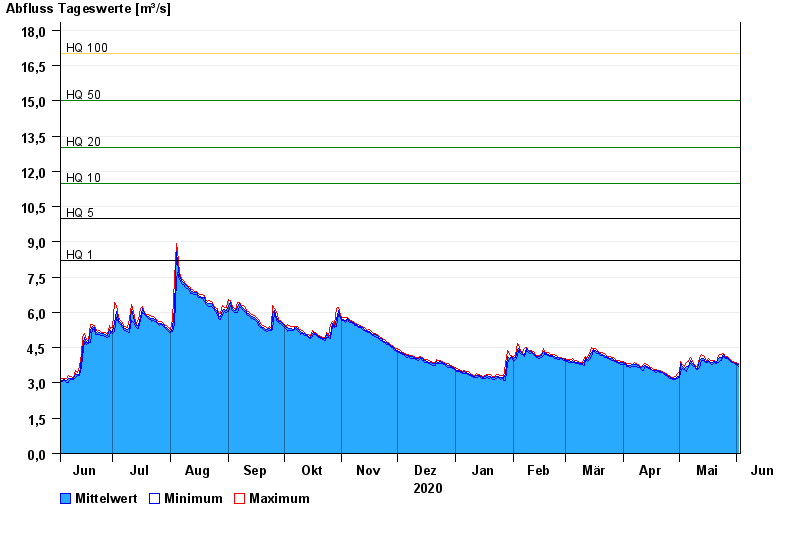
- HQ1 8,2 m³/s
- HQ5 10 m³/s
- HQ10 11,5 m³/s
- HQ20 13 m³/s
- HQ50 15 m³/s
- HQ100 17 m³/s
| Date | Mean value [m³/s] | Maximum [m³/s] | Minimum [m³/s] |
|---|---|---|---|
| 02.06.2021 | 3.77 | 3.83 | 3.72 |
| 01.06.2021 | 3.81 | 3.86 | 3.78 |
| 31.05.2021 | 3.84 | 3.88 | 3.81 |
| 30.05.2021 | 3.89 | 3.93 | 3.86 |
| 29.05.2021 | 3.92 | 3.97 | 3.87 |
| 28.05.2021 | 4.01 | 4.06 | 3.96 |
| 27.05.2021 | 4.07 | 4.12 | 4.02 |
© Bayerisches Landesamt für Umwelt 2024