

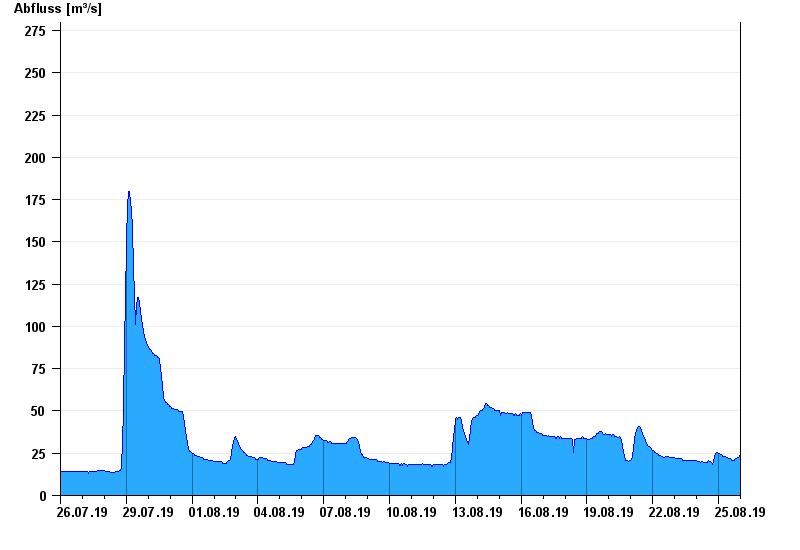
Chart of month Lenggries / Isar
Discharge from 26.07.2019 to 25.08.2019
- 02.07.1954 Abfluss: 608 m³/s
- 23.08.2005 Abfluss: 571 m³/s
- 13.09.1956 Abfluss: 540 m³/s
- 09.07.1955 Abfluss: 482 m³/s
- 22.05.1999 Abfluss: 454 m³/s
| Date | Runoff [m³/s] |
|---|---|
| 26.08.2019 00:45 | 25.8 |
| 26.08.2019 00:30 | 24.9 |
| 26.08.2019 00:15 | 24.9 |
| 26.08.2019 00:00 | 24.9 |
| 25.08.2019 23:45 | 24.9 |
| 25.08.2019 23:30 | 24.1 |
| 25.08.2019 23:15 | 23.3 |
© Bayerisches Landesamt für Umwelt 2024