
- Start >
- Rivers >
- Discharge >
- Isar >
- Langengeisling >
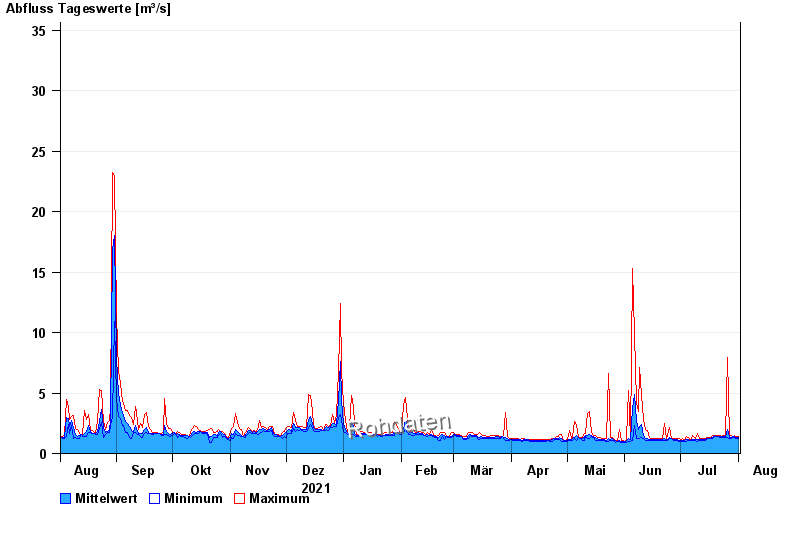
- Chart of year

Chart of year Langengeisling / Saubach
Discharge from 02.08.2021 to 01.08.2022
- 03.06.2013 Abfluss: 77,2 m³/s
- 01.02.1985 Abfluss: 41,7 m³/s
- 02.08.1991 Abfluss: 37,8 m³/s
- 15.02.1990 Abfluss: 35,7 m³/s
- 07.06.1995 Abfluss: 35,5 m³/s
| Date | Mean value [m³/s] | Maximum [m³/s] | Minimum [m³/s] |
|---|---|---|---|
| 01.08.2022 | 1.32 | 1.41 | 1.21 |
| 31.07.2022 | 1.33 | 1.41 | 1.21 |
| 30.07.2022 | 1.37 | 1.52 | 1.3 |
| 29.07.2022 | 1.37 | 1.41 | 1.3 |
| 28.07.2022 | 1.36 | 1.52 | 1.21 |
| 27.07.2022 | 1.35 | 1.41 | 1.21 |
| 26.07.2022 | 2 | 7.92 | 1.3 |
© Bayerisches Landesamt für Umwelt 2024