
- Start >
- Rivers >
- Discharge >
- Isar >
- Langengeisling >
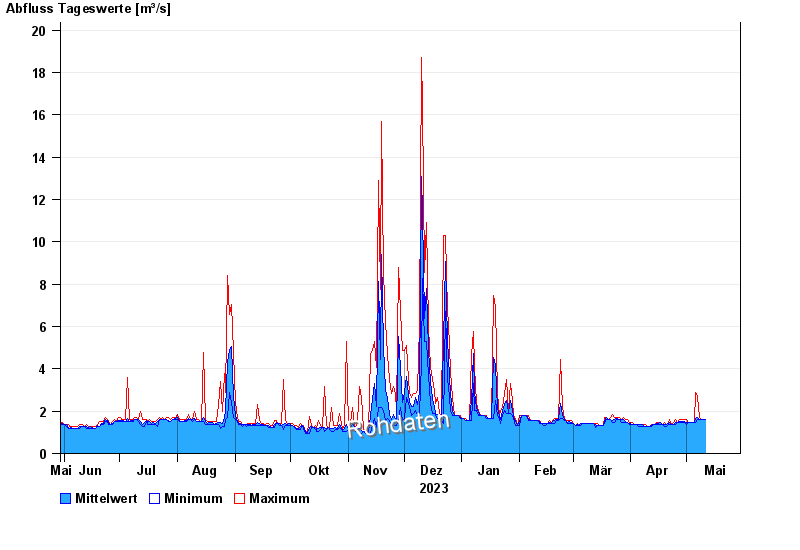
- Chart of year

Chart of year Langengeisling / Saubach
Discharge from 30.05.2023 to 29.05.2024
| Date | Mean value [m³/s] | Maximum [m³/s] | Minimum [m³/s] |
|---|---|---|---|
| 29.05.2024 | 2.17 | 3.57 | 1.59 |
| 28.05.2024 | 3.19 | 6.53 | 1.71 |
| 27.05.2024 | 1.63 | 4.95 | 1.48 |
| 26.05.2024 | 1.56 | 1.59 | 1.48 |
| 25.05.2024 | 1.66 | 1.71 | 1.59 |
| 24.05.2024 | 2.03 | 3.4 | 1.59 |
| 23.05.2024 | 1.67 | 3.57 | 1.48 |
© Bayerisches Landesamt für Umwelt 2024