
- Start >
- Rivers >
- Discharge >
- Isar >
- Langengeisling >
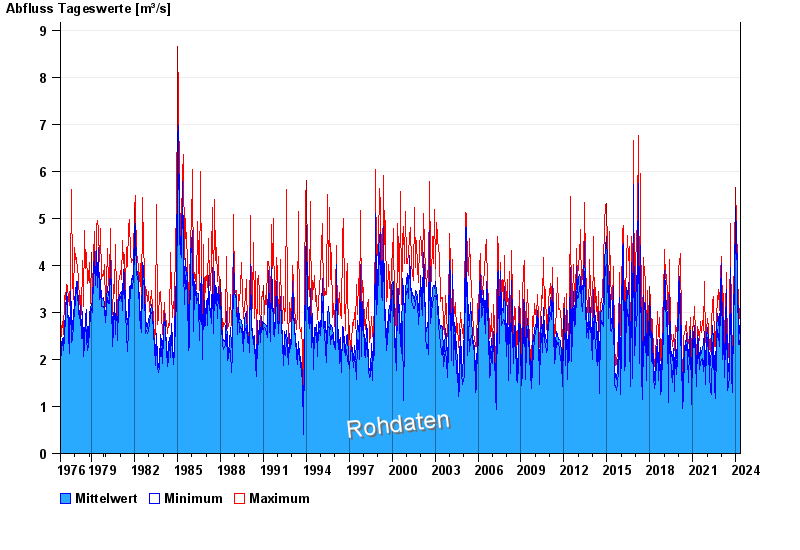
- Chart of total period

Chart of total period Langengeisling / Sempt
Discharge from 01.11.1976 to 02.05.2024
| Date | Mean value [m³/s] | Maximum [m³/s] | Minimum [m³/s] |
|---|---|---|---|
| 02.05.2024 | 1.74 | 1.77 | 1.7 |
| 01.05.2024 | 1.86 | 2.23 | 1.49 |
| 30.04.2024 | 1.87 | 2.15 | 1.7 |
| 29.04.2024 | 1.78 | 1.92 | 1.56 |
| 28.04.2024 | 1.84 | 2.07 | 1.63 |
| 27.04.2024 | 1.86 | 2.07 | 1.56 |
| 26.04.2024 | 1.97 | 1.99 | 1.85 |
© Bayerisches Landesamt für Umwelt 2024