
- Start >
- Rivers >
- Discharge >
- Isar >
- Landshut Flutmulde >
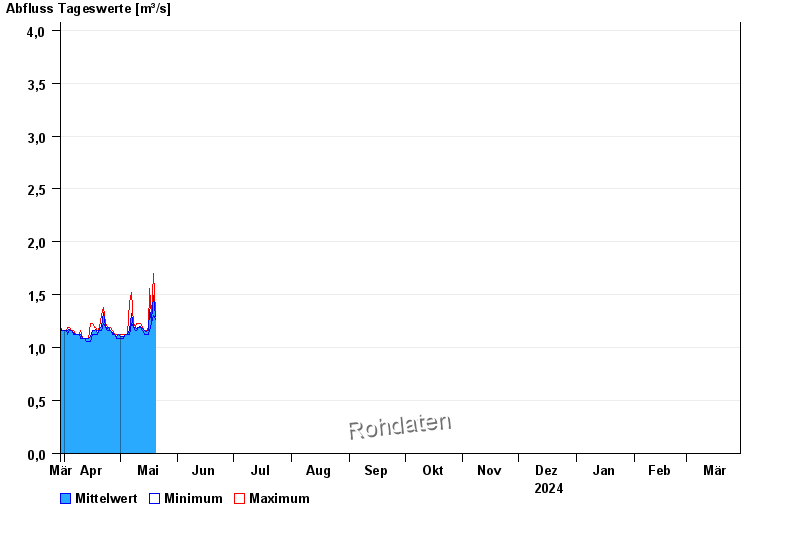
- Chart of year

Chart of year Landshut Flutmulde / Isar
Discharge from 30.03.2024 to 29.03.2025
 Für diesen Pegel sind keine Jährlichkeiten hinterlegt.
| Date | Mean value [m³/s] | Maximum [m³/s] | Minimum [m³/s] |
|---|---|---|---|
| 10.05.2024 | 1.17 | 1.19 | 1.16 |
| 09.05.2024 | 1.19 | 1.19 | 1.16 |
| 08.05.2024 | 1.2 | 1.23 | 1.19 |
| 07.05.2024 | 1.32 | 1.52 | 1.23 |
| 06.05.2024 | 1.16 | 1.43 | 1.12 |
| 05.05.2024 | 1.12 | 1.12 | 1.12 |
| 04.05.2024 | 1.12 | 1.12 | 1.12 |
© Bayerisches Landesamt für Umwelt 2024