
- Start >
- Rivers >
- Discharge >
- Isar >
- Landshut Flutmulde >
- Chart of year

Chart of year Landshut Flutmulde / Isar
Discharge from 01.01.2018 to 31.12.2018
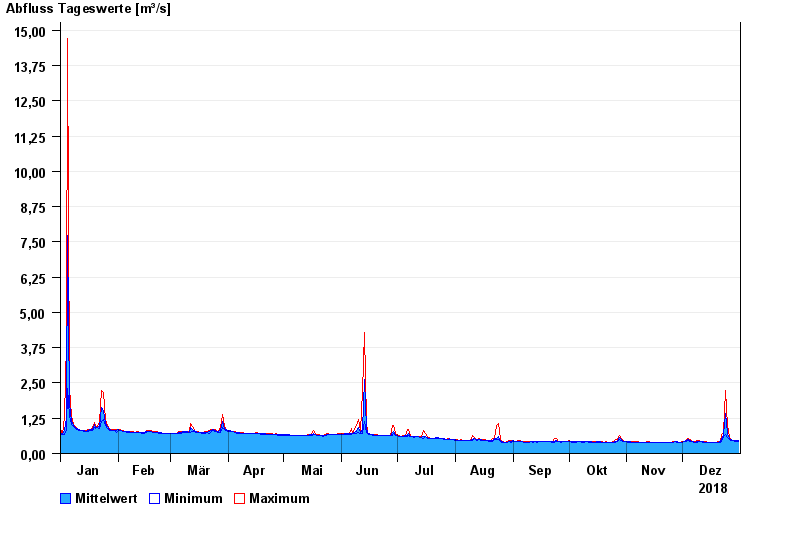
| Date | Mean value [m³/s] | Maximum [m³/s] | Minimum [m³/s] |
|---|---|---|---|
| 31.12.2018 | 0.459 | 0.47 | 0.439 |
| 30.12.2018 | 0.451 | 0.47 | 0.439 |
| 29.12.2018 | 0.443 | 0.454 | 0.439 |
| 28.12.2018 | 0.467 | 0.47 | 0.454 |
| 27.12.2018 | 0.486 | 0.505 | 0.47 |
| 26.12.2018 | 0.532 | 0.567 | 0.505 |
| 25.12.2018 | 0.699 | 0.986 | 0.567 |
© Bayerisches Landesamt für Umwelt 2024