
- Start >
- Rivers >
- Discharge >
- Isar >
- Landshut Flutmulde >
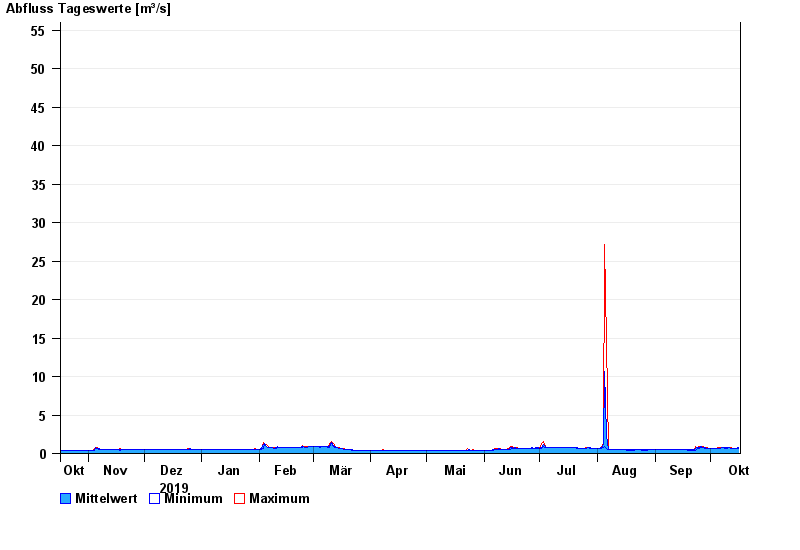
- Chart of year

Chart of year Landshut Flutmulde / Isar
Discharge from 17.10.2019 to 16.10.2020
 Für diesen Pegel sind keine Jährlichkeiten hinterlegt.
| Date | Mean value [m³/s] | Maximum [m³/s] | Minimum [m³/s] |
|---|---|---|---|
| 16.10.2020 | 0.743 | 0.774 | 0.706 |
| 15.10.2020 | 0.706 | 0.706 | 0.706 |
| 14.10.2020 | 0.703 | 0.706 | 0.684 |
| 13.10.2020 | 0.706 | 0.706 | 0.706 |
| 12.10.2020 | 0.708 | 0.728 | 0.706 |
| 11.10.2020 | 0.737 | 0.751 | 0.728 |
| 10.10.2020 | 0.719 | 0.751 | 0.706 |
© Bayerisches Landesamt für Umwelt 2024