

Chart of total period Kraiburg / Inn
Discharge from 01.11.1951 to 03.05.2024
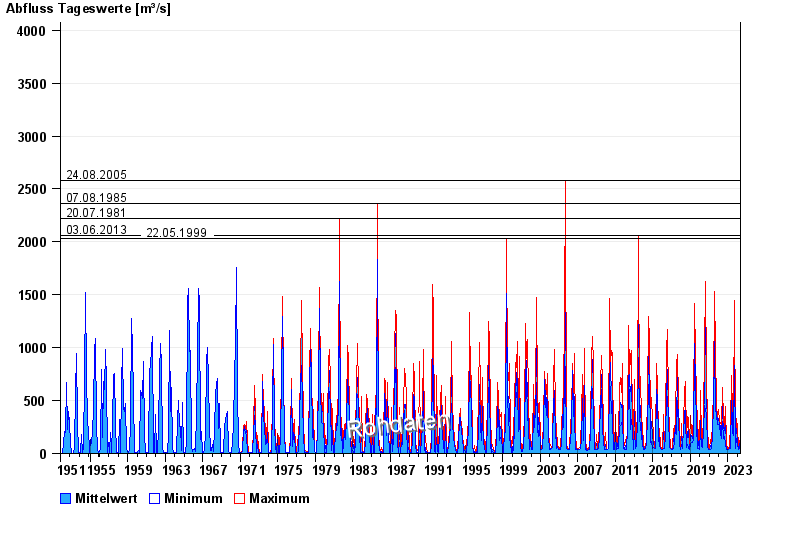
- 24.08.2005 Abfluss: 2580 m³/s
- 07.08.1985 Abfluss: 2360 m³/s
- 20.07.1981 Abfluss: 2220 m³/s
- 03.06.2013 Abfluss: 2060 m³/s
- 22.05.1999 Abfluss: 2030 m³/s
| Date | Mean value [m³/s] | Maximum [m³/s] | Minimum [m³/s] |
|---|---|---|---|
| 03.05.2024 | 53.8 | 53.8 | 53.8 |
| 02.05.2024 | 53.8 | 53.8 | 53.8 |
| 01.05.2024 | 53.7 | 53.8 | 50.4 |
| 30.04.2024 | 48.7 | 49.2 | 48.2 |
| 29.04.2024 | 47.8 | 49.2 | 47.1 |
| 28.04.2024 | 47.1 | 47.1 | 47.1 |
| 27.04.2024 | 47.1 | 47.1 | 47.1 |
© Bayerisches Landesamt für Umwelt 2024