

Chart of year Kollbach / Kollbach
Discharge from 25.01.2021 to 24.01.2022
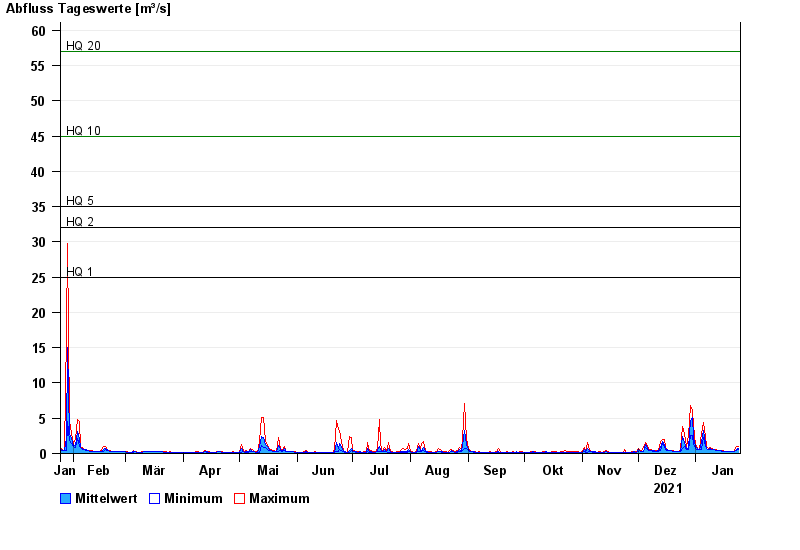
- HQ1 25 m³/s
- HQ2 32 m³/s
- HQ5 35 m³/s
- HQ10 45 m³/s
- HQ20 57 m³/s
- HQ50 72 m³/s
- HQ100 90 m³/s
| Date | Mean value [m³/s] | Maximum [m³/s] | Minimum [m³/s] |
|---|---|---|---|
| 24.01.2022 | 0.727 | 0.941 | 0.612 |
| 23.01.2022 | 0.621 | 0.941 | 0.466 |
| 22.01.2022 | 0.34 | 0.466 | 0.282 |
| 21.01.2022 | 0.291 | 0.309 | 0.282 |
| 20.01.2022 | 0.31 | 0.338 | 0.309 |
| 19.01.2022 | 0.314 | 0.338 | 0.309 |
| 18.01.2022 | 0.309 | 0.309 | 0.309 |
© Bayerisches Landesamt für Umwelt 2024