

Chart of year Kirchberg / Mertseebach
Discharge from 01.01.2020 to 31.12.2020
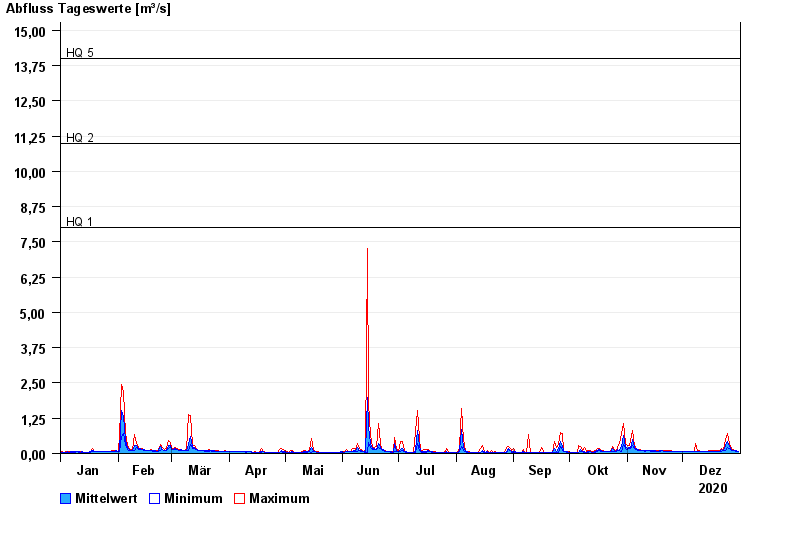
- HQ1 8 m³/s
- HQ2 11 m³/s
- HQ5 14 m³/s
- HQ10 18 m³/s
- HQ20 22 m³/s
- HQ50 28 m³/s
- HQ100 33 m³/s
| Date | Mean value [m³/s] | Maximum [m³/s] | Minimum [m³/s] |
|---|---|---|---|
| 31.12.2020 | 0.087 | 0.087 | 0.087 |
| 30.12.2020 | 0.089 | 0.098 | 0.087 |
| 29.12.2020 | 0.103 | 0.123 | 0.098 |
| 28.12.2020 | 0.118 | 0.15 | 0.11 |
| 27.12.2020 | 0.142 | 0.164 | 0.122 |
| 26.12.2020 | 0.235 | 0.371 | 0.164 |
| 25.12.2020 | 0.438 | 0.697 | 0.227 |
© Bayerisches Landesamt für Umwelt 2024