

Chart of year Kirchberg / Mertseebach
Discharge from 01.01.2023 to 31.12.2023
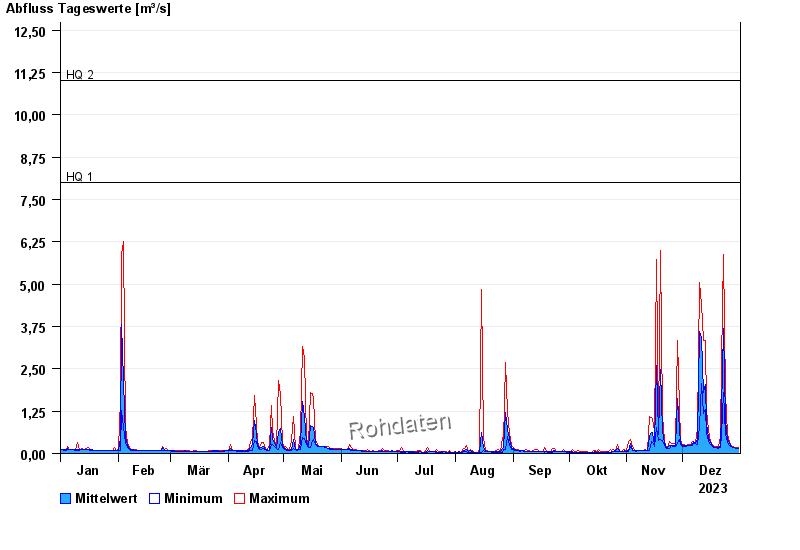
- HQ1 8 m³/s
- HQ2 11 m³/s
- HQ5 14 m³/s
- HQ10 18 m³/s
- HQ20 22 m³/s
- HQ50 28 m³/s
- HQ100 33 m³/s
| Date | Mean value [m³/s] | Maximum [m³/s] | Minimum [m³/s] |
|---|---|---|---|
| 31.12.2023 | 0.153 | 0.182 | 0.15 |
| 30.12.2023 | 0.152 | 0.166 | 0.15 |
| 29.12.2023 | 0.168 | 0.182 | 0.166 |
| 28.12.2023 | 0.184 | 0.199 | 0.182 |
| 27.12.2023 | 0.213 | 0.234 | 0.199 |
| 26.12.2023 | 0.283 | 0.327 | 0.234 |
| 25.12.2023 | 0.409 | 0.554 | 0.327 |
© Bayerisches Landesamt für Umwelt 2024