

Chart of year Kinning / Rott
Discharge from 01.01.2021 to 31.12.2021
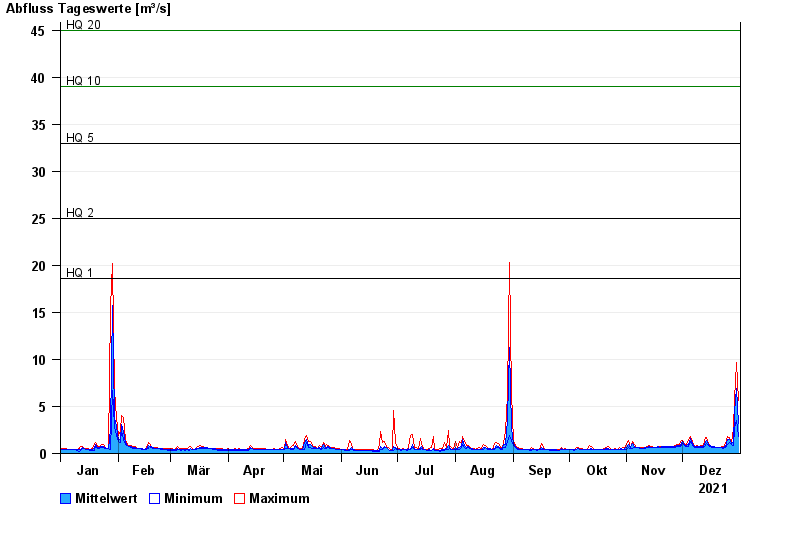
- HQ1 18,6 m³/s
- HQ2 25 m³/s
- HQ5 33 m³/s
- HQ10 39 m³/s
- HQ20 45 m³/s
- HQ50 53 m³/s
- HQ100 59 m³/s
| Date | Mean value [m³/s] | Maximum [m³/s] | Minimum [m³/s] |
|---|---|---|---|
| 31.12.2021 | 3.17 | 5.63 | 1.8 |
| 30.12.2021 | 6.92 | 9.68 | 3.51 |
| 29.12.2021 | 4.46 | 5.77 | 2.64 |
| 28.12.2021 | 1.15 | 2.64 | 0.869 |
| 27.12.2021 | 1.06 | 1.18 | 0.968 |
| 26.12.2021 | 1.46 | 1.67 | 1.18 |
| 25.12.2021 | 1.48 | 1.8 | 0.968 |
© Bayerisches Landesamt für Umwelt 2024