

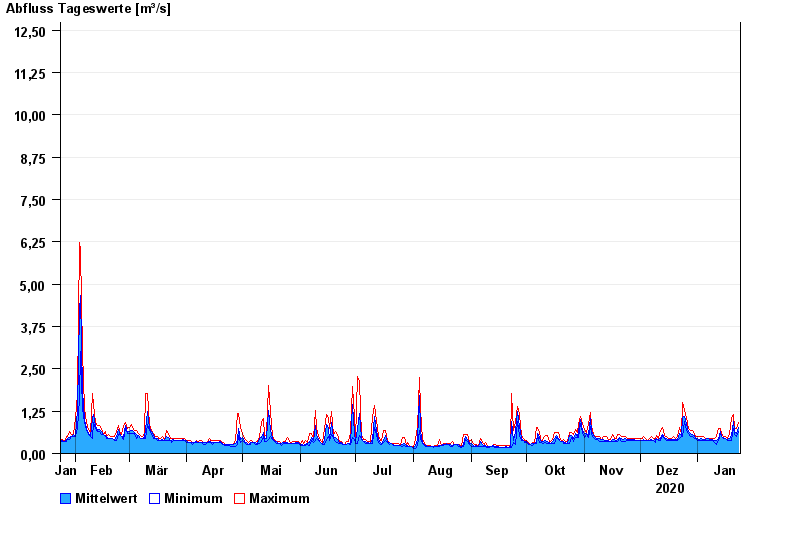
Chart of year Kinning / Rott
Discharge from 24.01.2020 to 23.01.2021
- HQ1 18,6 m³/s
- HQ2 25 m³/s
- HQ5 33 m³/s
- HQ10 39 m³/s
- HQ20 45 m³/s
- HQ50 53 m³/s
- HQ100 59 m³/s
| Date | Mean value [m³/s] | Maximum [m³/s] | Minimum [m³/s] |
|---|---|---|---|
| 23.01.2021 | 0.757 | 0.925 | 0.654 |
| 22.01.2021 | 0.603 | 0.739 | 0.501 |
| 21.01.2021 | 0.653 | 0.74 | 0.575 |
| 20.01.2021 | 0.957 | 1.14 | 0.74 |
| 19.01.2021 | 0.529 | 1.03 | 0.37 |
| 18.01.2021 | 0.435 | 0.577 | 0.37 |
| 17.01.2021 | 0.412 | 0.435 | 0.37 |
© Bayerisches Landesamt für Umwelt 2024