

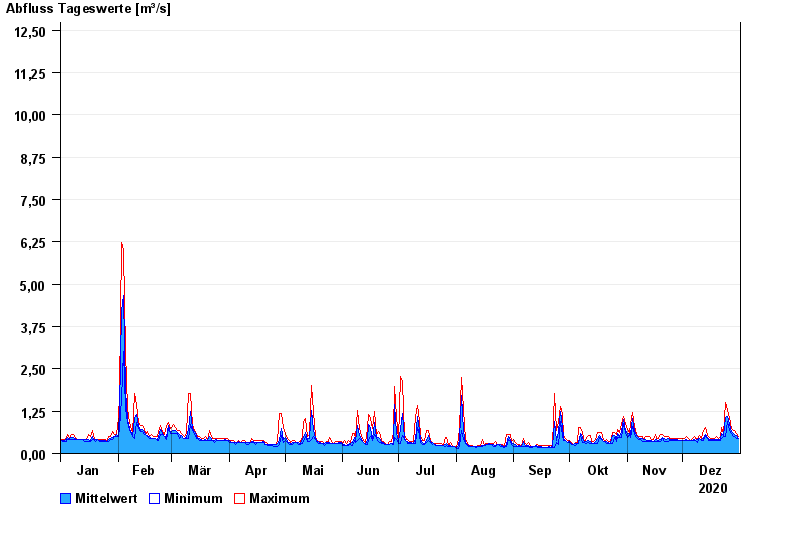
Chart of year Kinning / Rott
Discharge from 01.01.2020 to 31.12.2020
- HQ1 18,6 m³/s
- HQ2 25 m³/s
- HQ5 33 m³/s
- HQ10 39 m³/s
- HQ20 45 m³/s
- HQ50 53 m³/s
- HQ100 59 m³/s
| Date | Mean value [m³/s] | Maximum [m³/s] | Minimum [m³/s] |
|---|---|---|---|
| 31.12.2020 | 0.451 | 0.51 | 0.44 |
| 30.12.2020 | 0.522 | 0.585 | 0.441 |
| 29.12.2020 | 0.552 | 0.666 | 0.511 |
| 28.12.2020 | 0.587 | 0.666 | 0.511 |
| 27.12.2020 | 0.664 | 0.752 | 0.586 |
| 26.12.2020 | 0.857 | 1.05 | 0.667 |
| 25.12.2020 | 1.09 | 1.27 | 0.942 |
© Bayerisches Landesamt für Umwelt 2024